19.10.2026
Forschung
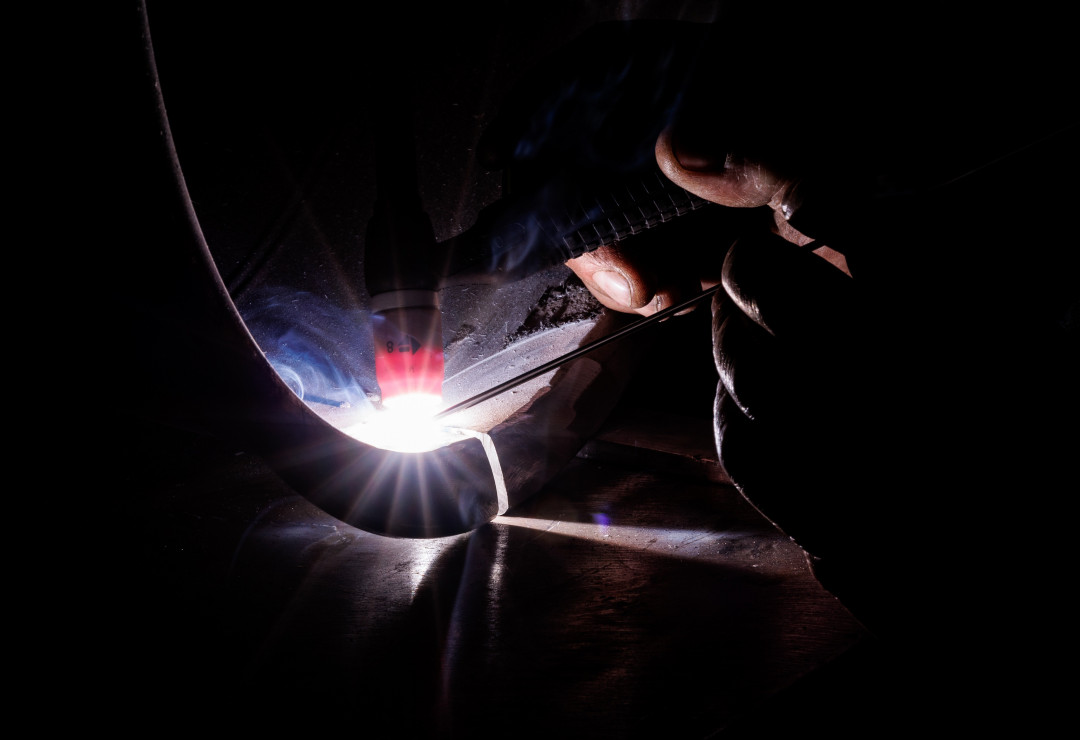
The quality of electrical connections is crucial for applications in energy technology, electromobility and power electronics. Ultrasonic metal welding (USMW) of aluminium and copper components offers great potential in this regard, but so far there has been no practical, non-destructive testing method for predicting connection quality. In the EleQuant (IGF 01I21956N) project, a methodology was developed based on the in-situ recorded temperature during short-term high-current loading. Representative samples, a newly developed high-current test bench and validated optical temperature measurements were used for this purpose. The results show a clear correlation between temperature profiles and shear tensile strength. Data-driven models can be used to reliably predict mechanical properties – much more accurately than with classic resistance measurements, such as the 4-wire measurement method. For the first time, a non-destructive, process-oriented testing method is available that could help to reduce scrap, optimise parameters and make quality assurance more efficient. The method offers high industrial potential and opens up prospects for integration into automated production processes.
1 Introduction
The reliable production of electrically high-strength connections is of central importance for numerous applications in energy technology, electromobility and power electronics. Various material-bonding welding processes are available for this purpose, including laser beam welding [1...3], electron beam welding [4; 5], friction stir welding [6...8] and ultrasonic welding [2; 9; 10]. Ultrasonic welding has established itself due to its suitability for soft materials such as aluminium and copper, which are often used in mixed construction. Typical fields of application range from on-board power supply connections and battery cell contacts to power semiconductors.
In addition to mechanical strength, an essential quality criterion for such connections is the long-term guarantee of low contact resistance. However, classic electrical characterisation methods, such as four-wire measurements, are only of limited use in reliably mapping the connection quality. Faulty welds – caused by incomplete connections, intermetallic phases or so-called "kissing bonds" – can fail prematurely under thermal or mechanical stress, even if the contact resistance is initially low [2; 11]. The destructive mechanical testing commonly used in industry, which is based on the definition of threshold values within the framework of statistical process design and subsequent random sampling, is nevertheless only a temporary solution.
Currently, there is no standardised short-term test for electrical quality that would be comparable to mechanical testing methods for relevant material cross-sections and processes. Instead, extensive mechanical tests and ageing studies are required, which are costly to perform and pose considerable hurdles, especially for small and medium-sized enterprises. With increasing electrification and growing requirements for functional safety, for example in the automotive sector (ISO 26262) [12], there is a growing need for sensitive, fast and practical quality testing. Against this background, the EleQuant research project aims to identify an easily implementable measurement parameter for the connection quality in ultrasonic welding. The focus is on the temperature development recorded in situ during the application of current to the joined parts. This can be regarded as a sensitive indicator of the thermal processes in the joining zone and, for the first time, enables a process-oriented, non-destructive evaluation of mechanical strength.
2 Materials, test system and measurement technology
2.1 Sample geometry
Aluminium–aluminium and aluminium–copper (sheet metal–sheet metal) overlap joints with joint areas of 12 mm², Fig. 1, and 64 mm² are being investigated. Since ultra-sonic welding is sensitive to numerous influencing factors, all materials of a given type come from a single batch in order to ensure consistent initial conditions and introduce specific process variations. Before the test series, the materials are comprehensively characterised: chemical composition, microstructure and hardness testing, tensile tests on the base material and investigations of the surface condition (roughness and surface energy) ensure the consistency of the samples.

2.2 Test bench
The high-current test bench, shown in Fig. 2, consists of a welding power source (PrimusHFI, Harms & Wende) with an integrated MFDC inverter and a 20 kA transformer. Reproducible current profiles with high dynamics are achieved via a 10 kHz control system. With the help of the KCA software (Kapkon), current curves in the form of ramps, blocks or setpoints (current, voltage, temperature) can be freely defined and adapted to the respective sample. The sample holder is integrated into an external cooling system. Two pneumatic cylinders (piston diameter 80 mm, system pressure 0.6 MPa, theoretical force per cylinder 3016 N) are used for secure mounting. The samples are pressed onto a water-cooled copper block via a brass disc (Ø 35 mm), which also ensures the electrical connection to the power source. The brass disc is electrically insulated and has contacts for voltage measurement so that the dynamic course of the transition resistance of the samples can be recorded.
The test chamber measures 730 × 900 × 1080 mm and allows large-format samples to be examined. Polycarbonate discs and an extraction system protect the operating personnel from splashes and outgassing. The power electronics are soundproofed to re-duce the acoustic load on operating and hall personnel, even during longer test cycles. A boom is mounted on the test chamber ceiling for optical temperature measurement.
2.3 Measurement technology
The temperature of the ultrasonic welding samples is recorded optically, either over a large area using a VarioCAM hr research 780 s thermographic camera or at specific points using CTlaser 4M pyrometers. The thermographic camera covers a temperature range from -40 °C to +1200 °C, with a resolution of ± 1 K (0–100 °C) or ± 1 % for temperatures < 0 °C, or > 100 °C, and an image frequency of 50 Hz and a detector format of 640 × 480 pixels. The pyrometers stand out from the thermography camera in particular with a noticeably higher data rate of 1000 Hz.
An NCS Industry Current Sensor 125-4 is used to record the current curve, measuring direct, alternating and pulsating currents up to 20 kA. Data is acquired and stored using modular NI hardware (cDAQ-9174 with NI-9215/9421 modules) and an application-specific LabVIEW programme. All measurements are started synchronously with the test sequence to ensure a time-correlated evaluation of current, voltage and temperature. Thermography data is analysed in the IRBIS 3.1 professional software, hotspots are identified and temperature curves are documented.
3 Results
3.1 Validation of temperature measurement
Since bare metal surfaces have a low emissivity, the samples are coated for optical temperature measurement: either completely with boron nitride or selectively with black paint. Boron nitride allows for high-temperature-stable measurements, while black paint is particularly suitable for low to medium temperatures. Optical temperature measurements are validated by comparison with tactile type-K thermocouples. The experimentally determined emissivities are adjusted to the respective sensor positions to compensate for reflection effects and measurement angle influences. Measurements show that separate emissivity values are determined for each pyrometer in order to minimise possible errors due to angular offset caused by the arrangement. This results in experimentally determined emissivity values of ε = 0.92-0.96 for the pyrometers.
Investigations into the layer thickness and possible errors in the paint or boron nitride layer confirm that uneven coatings can influence heat radiation and thus the measured temperatures. The validation therefore includes both large-area thermographic measurements to detect hotspots and selective pyrometer measurements for precise temperature values at defined locations.
3.2 Welding samples for validating the temperature measurement
To validate the temperature measurement, weld samples with different parameters are produced so that a wide range of process conditions can be covered. This variation enables the visualisation of differences in temperature profiles and their correlation with mechanical strength. Aluminium-aluminium and aluminium-copper joints are welded under defined pressure, amplitude and energy conditions, Tables 1 and 2.
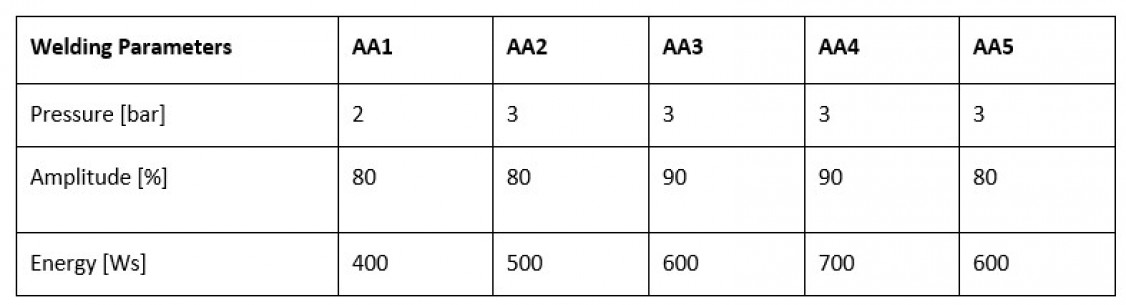
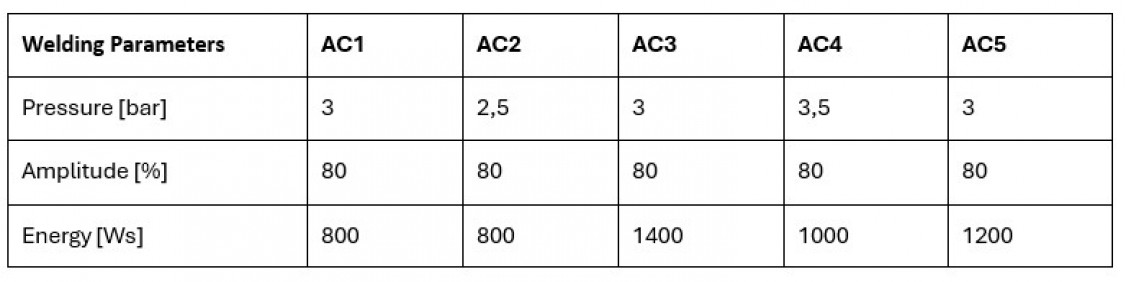
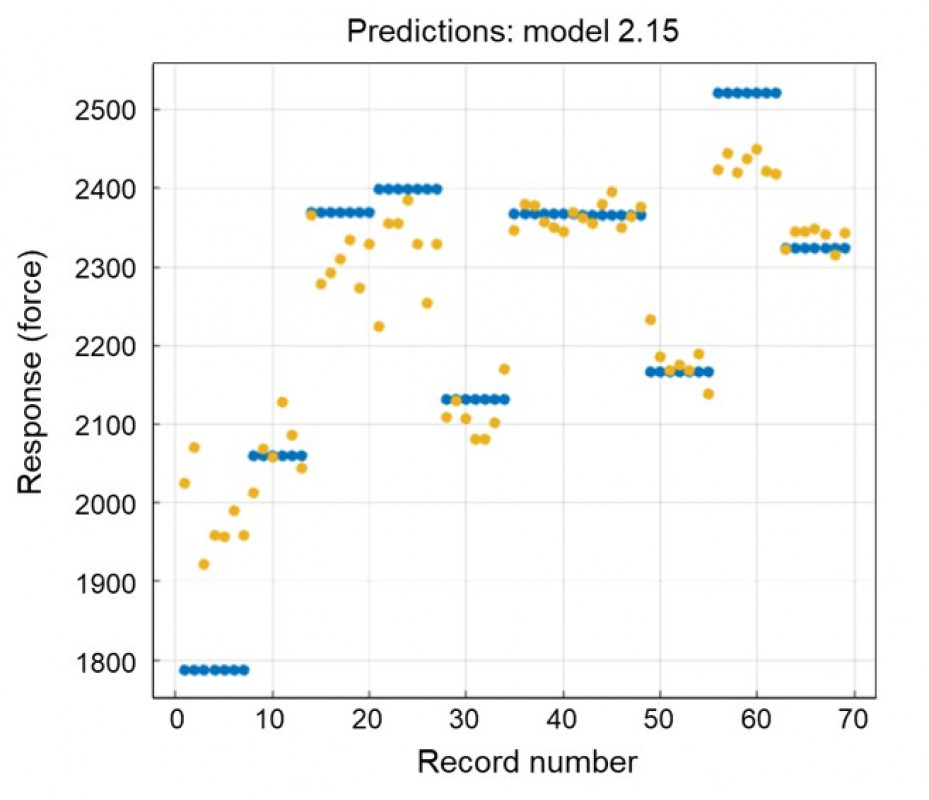
The mechanical strength of the samples is determined by shear tensile tests, with a dis-tinction being made between three load levels: low load without failure, medium load with partial failure and high load with complete failure. The results serve as a reference for the evaluation of the temperature measurements. The measured temperature curves are analysed using a random forest model to predict the shear tensile strengt, Fig. 3. This reveals a close correlation between the recorded temperature characteristics and the mechanical strength. High current loads and fast current rise rates ensure that the joint reacts primarily to the load.
3.3 Application and validation of the test methodology
To validate the developed test methodology, weld samples with aluminium–aluminium and aluminium–copper joints were produced under three distinct parameter sets: “underwelding” (insufficient energy), “optimised” (maximum strength), and “overwelding” (excessive energy). This variation allows the effect of the joining parameters on both the mechanical strength and the temperature profiles of the joints to be analysed, Fig. 4.
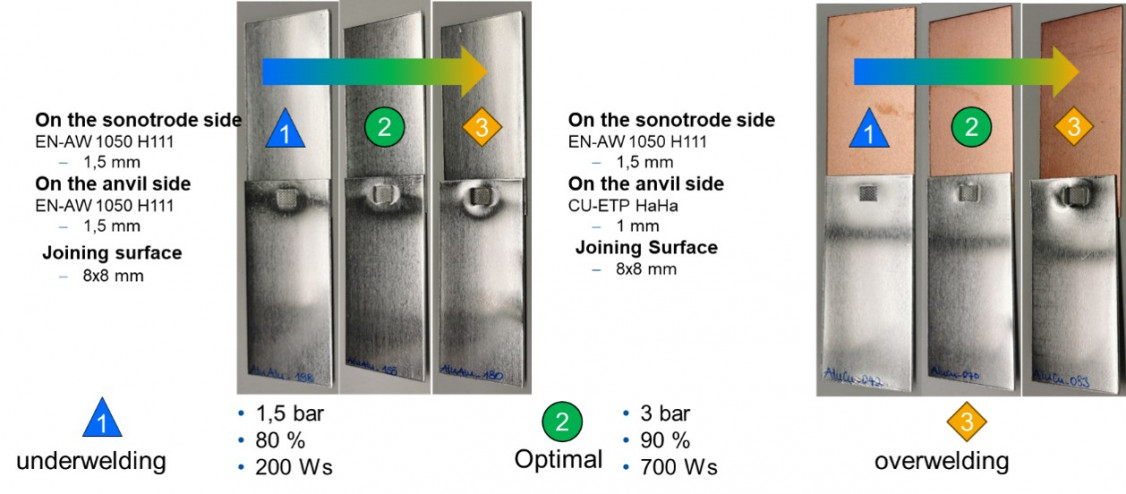
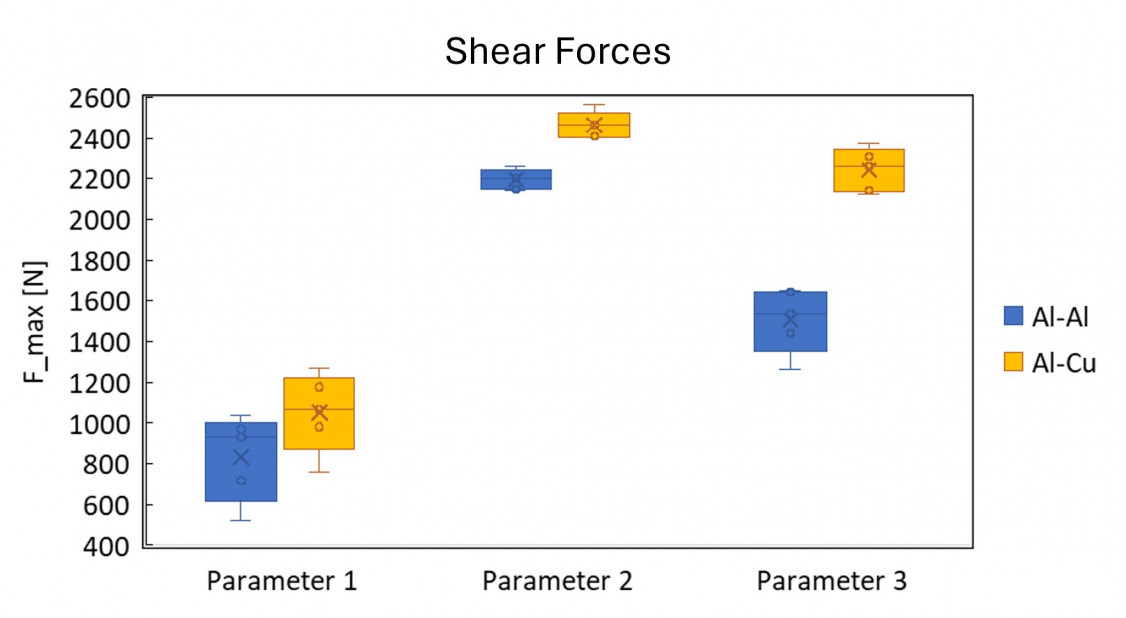
The temperature is recorded during short-term electrical loads, with the maximum temperature limited to 150 °C to prevent damage to the samples. The measurement curves show that a high sampling rate is necessary for the evaluation. The corresponding current curves illustrate the transient response of the current source and the stable control of the current around the selected nominal values. Shear tests show that the optimised parameter set 2 delivers the highest strengths with the lowest dispersion, while the non-optimised parameter sets 1 and 3 lead to greater dispersion of the results, Fig. 5. This underlines the importance of targeted parameter selection for reproducible joint quality.
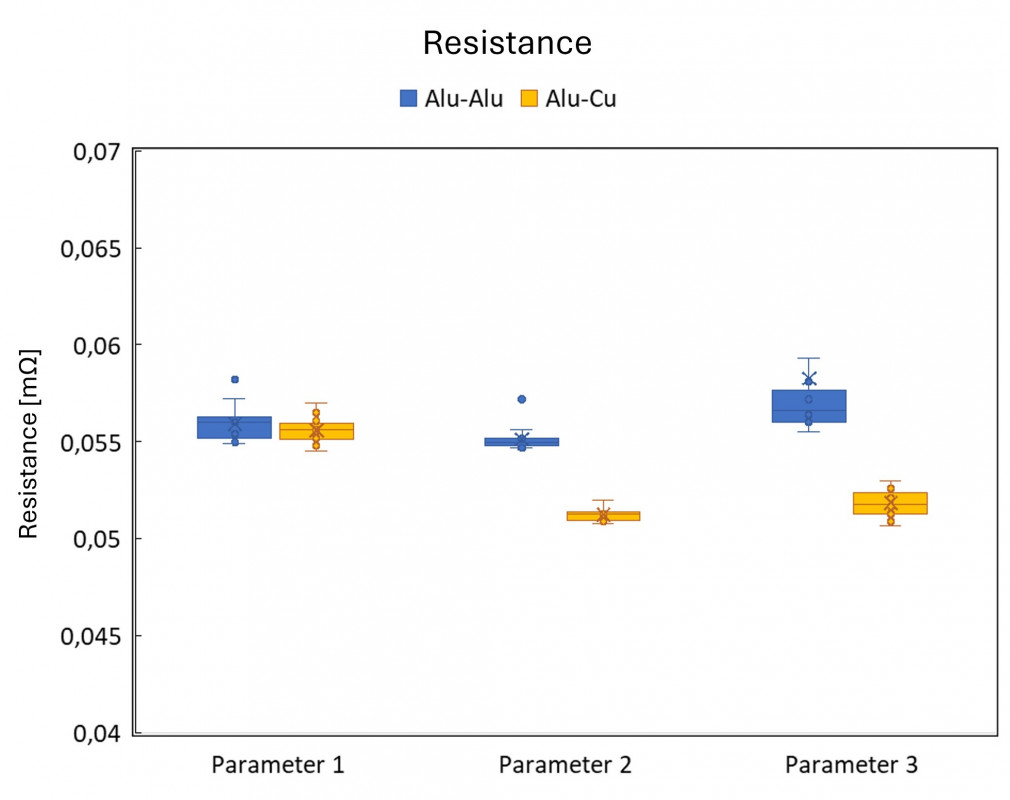
In comparison, classic resistance measurements after joining (10 A, 10 s, 2 Hz) do not provide any reliable information about the connection quality, as no significant difference in the contact resistance can be measured, Fig. 6 . This highlights the need for the developed methodology for precise evaluation of the connection quality.
3.4 Correlation analysis and non-destructive testing variant
To identify correlations between the joining parameters optimised in the preliminary tests and the tested samples, specific characteristic parameters from the electrical tests are used. For this purpose, three different current loads (5 kA, 9 kA and 13 kA) are selected, which subject the samples to different levels of thermal stress. The recorded temper-ature curves clearly show that the differences in connection quality increase with rising load, Fig. 7, and that the curves "fan out".
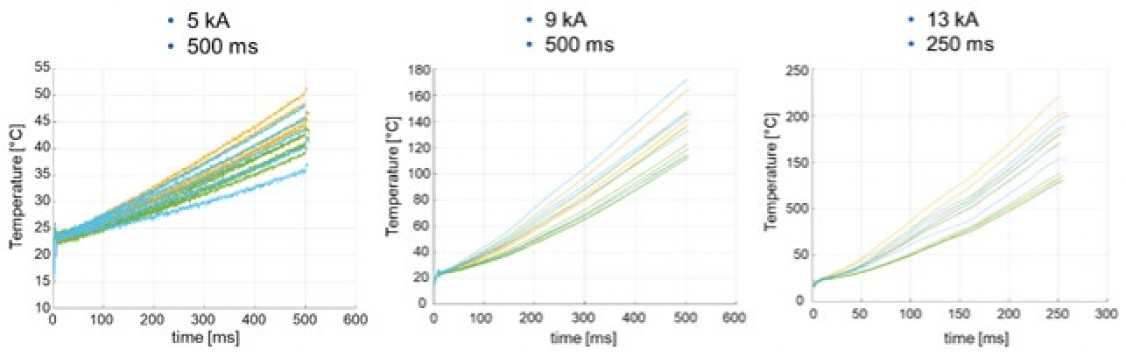
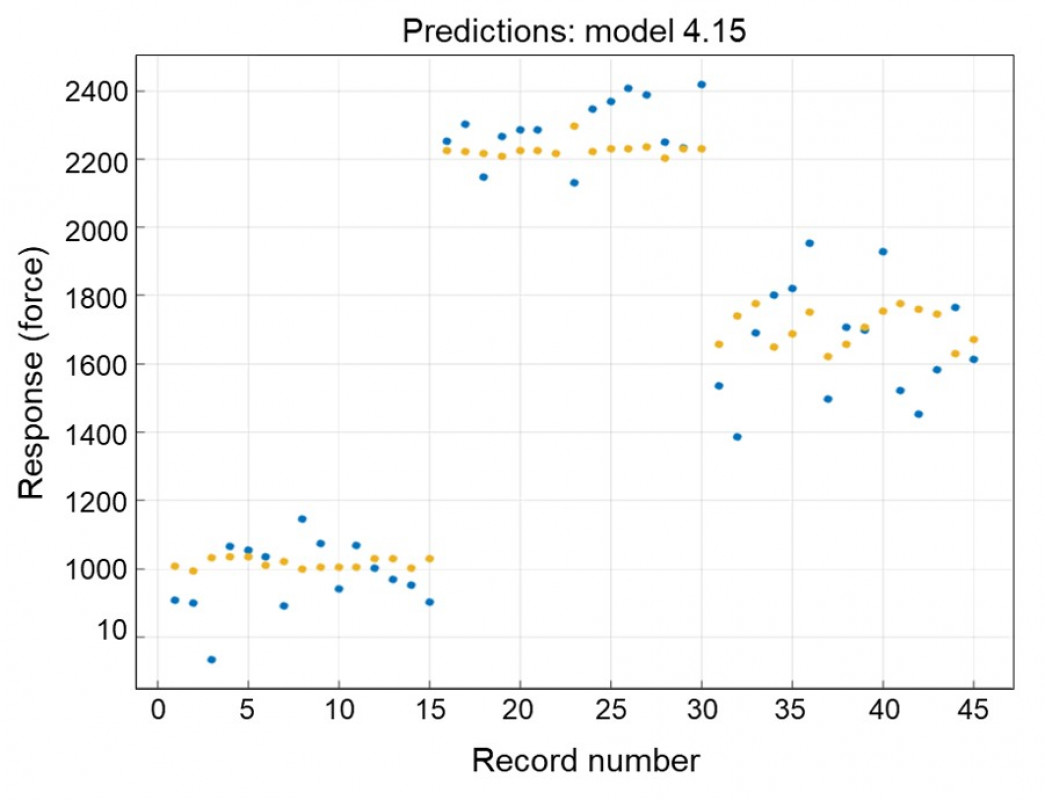
For evaluation purposes, the measurement curves are divided into the start-up range, load range and end-of-load range. This enables precise analysis of the response of the samples during the different phases of current loading. Characteristic parameters are derived from these ranges, reflecting the mechanical and electrical properties of the connections. The final random forest model shows that the mechanical strength of the connections can be reliably predicted from the electrical measurement, Fig. 8.
4 Discussion
The investigation shows that the mechanical strength of ultrasonic welded joints correlates closely with the selected joining parameters. Optimised parameter sets result in uniform and high shear tensile forces, while "underwelded" or "overwelded" leads to significantly lower and more scattered strengths. In order to ensure resilient joints, statistical process development with suitable, defined parameter windows is necessary. Optical temperature measurement has proven to be a key parameter for evaluating the welding process. The calibration of thermographic cameras and pyrometers, as well as the consideration of emissivity and coating thickness (boron nitride or black paint), are crucial for obtaining realistic temperature profiles. High and rapidly increasing current loads ensure that the sample reacts at the joint. The entire sample should only heat up to a small extent. The temperature profiles thus reflect the actual joint reaction and provide essential information about the strength of the joint.
The correlation between the measured temperature characteristics and the shear forces shows that mechanical properties can be reliably predicted from the temperature data. Random forest analysis confirms this close correlation and achieves a prediction accuracy of R² ≈ 0.96. This underlines that the measurement and evaluation methods developed enable non-destructive quality prediction and are therefore a valuable tool for process control and optimisation.
In comparison, conventional resistance measurements after joining do not provide reliable information about weld seam quality. External factors, such as heating of the entire sample, the measurement setup, or stresses within the setup itself, strongly influence the results, making the mechanical strength not reliably represented. These findings therefore highlight the superiority of the combined high-current and temperature measurement methodology over traditional testing approaches.
5 Summary and outlook
It has been shown that the quality of ultrasonic metal welds can be reliably assessed by combining electrical load tests and optical temperature measurements. The validation of the measurement methodology illustrates that precise recording of the temperature curve is crucial for predicting mechanical strength. Conventional resistance measurements, on the other hand, do not provide reliable information about the quality of the joint. The developed methodology allows a close correlation to be established between temperature profiles, current loads and shear tensile strength. The results prove that optimised joining parameters not only lead to higher strengths, but also to reproducible strengths. The use of data-based models such as Random Forest also enables robust strength prediction based on data from non-destructive testing.
Economically, this approach enables efficient, non-destructive 100 % testing of welded joints during or immediately after production. It reduces the need for costly destructive tests, minimises scrap and increases overall process efficiency. This is particularly beneficial for operational safety in safety-critical applications, such as the connection of high-current and high-voltage conductors in the automotive sector.
Further potential for the development of the methodology lies in the systematic correlation of current and voltage curves with the measured temperature profiles. While temperature measurement describes the thermal response of the material at the measurement position to the energy applied, current and voltage provide immediate information about the reaction of the joint and the sample. For data-driven predictive models, this allows the incorporation of additional features from current and voltage data, thereby further improving the prediction accuracy of mechanical strength. In the future, this offers the opportunity to supplement or, in certain applications, replace temperature measurements, thus enabling an inline testing strategy. Integration into industrial production lines would not only increase process reliability but also strengthen the competi-tiveness of manufacturers. In addition, further material combinations and geometries should be investigated to ensure the transferability of the results to a broader range of applications.
Authors: Ellen Wirtz, Eric Helfers, Jana Heine, Alexander Schiebahn, Uwe Reisgen
Aknowledgment
Project IGF 01I21956N/DVS No. 05.3427 of the Research Association of Deutscher Verband für Schweißen und verwandte Verfahren e. V. (DVS – The German Welding Society) is funded by the Federal Ministry for Economic Affairs and Energy on the basis of a resolution passed by the German Bundestag (German Parliament).
Furthermore, the authors thank the companies of the project advisory committee and their employees for their participation, constructive discussions and substantive contributions.
References
[1] Mai, T. A. u. A. Spowage: „Characterisation of Dissimilar Joints in Laser Welding of Steel–Kovar, Copper–Steel and Copper–Aluminium.,“ Journal of Physics: Conference Series 374, S. 224–233, 2004.
[2] Deutscher Verband für Schweißen und Verwandte Verfahren, DVS Congress 2015: Große Schweißtechnische Tagung ; DVS-Studentenkongress; Fügen von faserverstärkten Kunststoffen, Anwendungsnahe Schweißsimulation, Schulung
und Prüfung im DVS, IBESS - For-schungscluster „Bruchmechanik“ ; Vorträge der Veranstaltungen im Rahmen von DVS Congress und DVS Expo in Nürnberg vom 15. bis 17. September 2015 (DVS-Berichte 315). Düsseldorf: DVS Media, 2015.
[3] Schmidt, P. A.: Laserstrahlschweißen elektrischer Kontakte von Lithium-Ionen-Batterien in Elektro- und Hybridfahrzeugen. (Dissertation). München, 2015.
[4] Dilthey, U., u. K. Woeste, „Elektronenstrahlschweißen metallischer Werkstoffkombinati-onen.,“ Schweissen und Schneiden, Jg. 58, Nr. 6, S. 296–300, 2006.
[5] Otten, C., U. Reisgen u. M. Schmachtenberg, „Electron Beam Welding of Aluminum to Copper: Mechanical Properties and their Relation to Microstructure.,“ Welding in the World, Jg. 60, Nr. 1, S. 21–31, 2016.
[6] Giera, A.: Prozesstechnische Untersuchungen zum Rührreibschweißen metallischer Werkstoffe. Erlangen-Nürnberg, Univ,,“ Bericht aus dem Lehrstuhl für Fertigungstechnologie, Nr. 199, 2008.7] Eslami, N., A. Harms u. J. e. a. Deringer, „Dissimilar Friction Stir Butt Welding of Aluminum and Copper with Cross-Section Adjustment for Current-Carrying
Components.,“ Metals, Jg. 8, Nr. 661, S. 1–11, 2018.
[8] Tan, C. W., Z. G. Jiang u. L. e. a. Li, „Microstructural Evolution and Mechanical Properties of Dissimilar Al–Cu Joints Produced by Friction Stir Welding.,“ Materials & Design, Jg. 51, S. 466–473, 2013.
[9] Zhao, Y. Y., D. Li u. Y. S. Zhang, „Effect of Welding Energy on Interface Zone of Al–Cu Ultrasonic Welded Joint.,“ Science and Technology of Welding and Joining, Jg. 18, Nr. 4, S. 354–360, 2013.
[10] Fujii, H. T., et al.: Interfacial Microstructure Evolution and Weld Formation During Ultrasonic Welding of Al alloy to Cu., Materials Characterization, Jg. 139, S. 233–240, 2018.
[11] Pfeifer, S.: Einfluss intermetallischer Phasen der Systeme Al-Cu und Al-Ag auf den Widerstand stromtragender Verbindungen im Temperaturbereich von 90 °C bis 200 °C (Disserta-tion). Dresden, 2015.
[12] Road Vehicles – Functional Safety – Part 1: Vocabulary., ISO 26262-1:2018(E), Berlin