
31.08.2026
Fachbeitrag
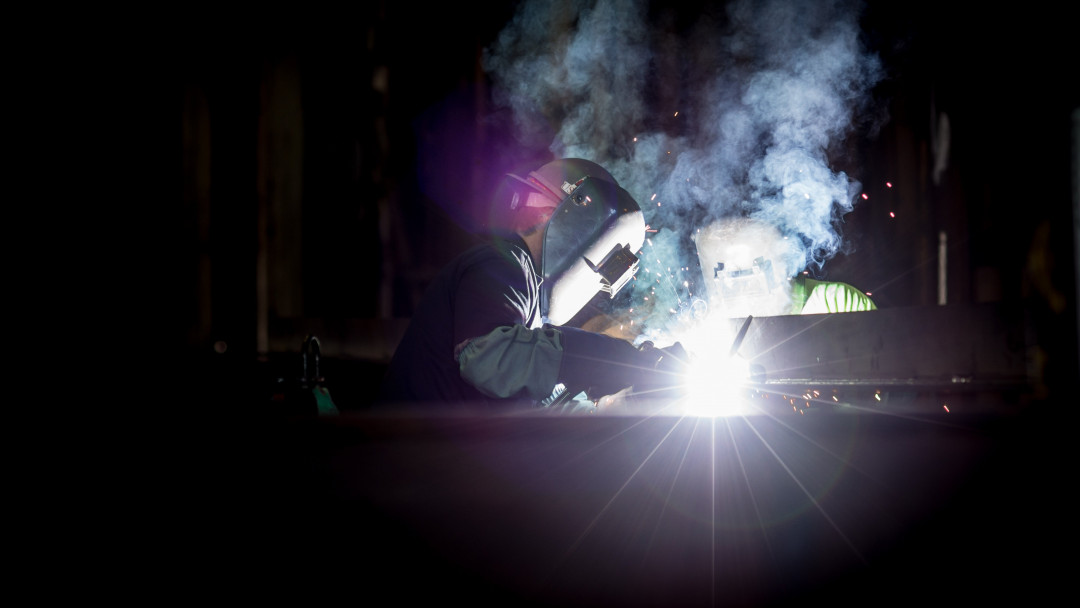
As part of the IGF research project 01IF22017N / DVS Q6.3429, extensive welding fume investigations of various process control variants were systematically analysed in order to gain a better understanding of welding fume formation. Specific electrical process parameters were used, such as the average arc voltage, short-circuit rate and average process power, which show a strong correlation with the welding fume emission rate (FER). These findings enable a differentiated classification of the process control variants available on the market in terms of their emissions and offer starting points for the targeted reduction of welding fumes.
DOI: https://doi.org/10.53192/HOW20260831
1 Introduction
Gas metal arc welding (GMAW) is an important joining process in metalworking and, thanks to its flexibility and cost-effectiveness, contributes significantly to the competitiveness of industry in high-wage countries. However, when an electric arc is used as a thermal tool, hazardous substances such as manganese and nickel oxides, chromium(VI) compounds, ozone and nitrogen oxides are inevitably released, which pose health risks to welding personnel [1; 2]. Current research approaches focus on process-related measures to reduce welding fume emissions through the use of digitally controlled process variants, rather than relying exclusively on costly fume extraction systems. Previous studies have already recognised the reduction potential of controlled process variants [3...5]. In particular, it was shown that, depending on the type of arc, different settings are required in order to achieve low welding fume emissions [4]. In addition, it was shown that welding fume emissions across all processes depend significantly on the arc power or the arc voltage. This dependence is not linear but rather follows a third-degree function with a local maximum and minimum [6]. However, these studies did not consider processes across different manufacturers. While the fundamental relationships between electrical process parameters and the FER have already been demonstrated for individual power sources [3; 7], their cross-manufacturer general validity has not yet been established. The novel contribution of this work therefore lies in verifying these correlations across process variants from several power source manufacturers and in classifying commercially available process control variants in an application-oriented manner according to their emission minimization potential. The aim of the work presented here is to identify process ranges with low welding fume emissions for the various process control variants and thus to meet the emission reduction requirements of occupational safety regulations.
With stricter occupational exposure limits for substances such as manganese and chromium(VI) since 2019, companies face technological challenges in compliance, requiring additional protective measures. Despite various available extraction concepts, such as externally ventilated helmets or external extraction devices in the immediate vicinity of the welding process, these often do not adequately protect all employees in the production environment due to limited effectiveness or practical limitations [8]. To identify the low-emission process ranges mentioned, process variants from different manufacturers are examined for their FER in three different power ranges. Adjustments to the process are made in order to minimise the FER. In addition, a comparison between three process variants at a single wire feed speed is analysed, as well as the influence of a CO2-reduced shielding gas in the selected power ranges.
2 Experimental setup
Various process variants with different power ranges were selected for the tests. The power range is defined here via the wire feed speed, which, through the synergy curve, simultaneously determines both the process power and the deposition rate. The wire feed speed is specified as a fixed control variable, with the set value and the actual value being identical. Care was taken to compare processes from different power source manufacturers in order to obtain an overview of the potential of the approaches used. The processes were classified and named in accordance with DVS data sheet 0973-1 [9]. On this basis, it is possible to compare the processes with one another. Table 1 shows the test matrix with the different processes. The wire feed speed was selected specifically for each process, as not all process variants are designed for all wire feed speeds. The welding speed and the contact tip-to-work distance (CTWD) are likewise based on practical empirical values. In addition to the process variants and power ranges, two shielding gases designated M21-ArC-18 and M20-ArC-8 were examined and compared in accordance with DIN EN ISO 14175 [10]. Furthermore, with the aim of achieving low welding fume emissions, the voltage correction (arc correction) and the dynamic setting at the power source were varied step by step. The voltage correction is generally used to make slight adjustments to the synergy curve in order to influence the process behavior. The dynamic is a parameter that was originally used to adapt the operating point to different boundary conditions. In modern power sources, this parameter is still used and primarily influences the pulse frequency and length in pulsed processes, as well as, in some cases, the current rise rate in short arc processes. However, this is implemented differently from one manufacturer to another.
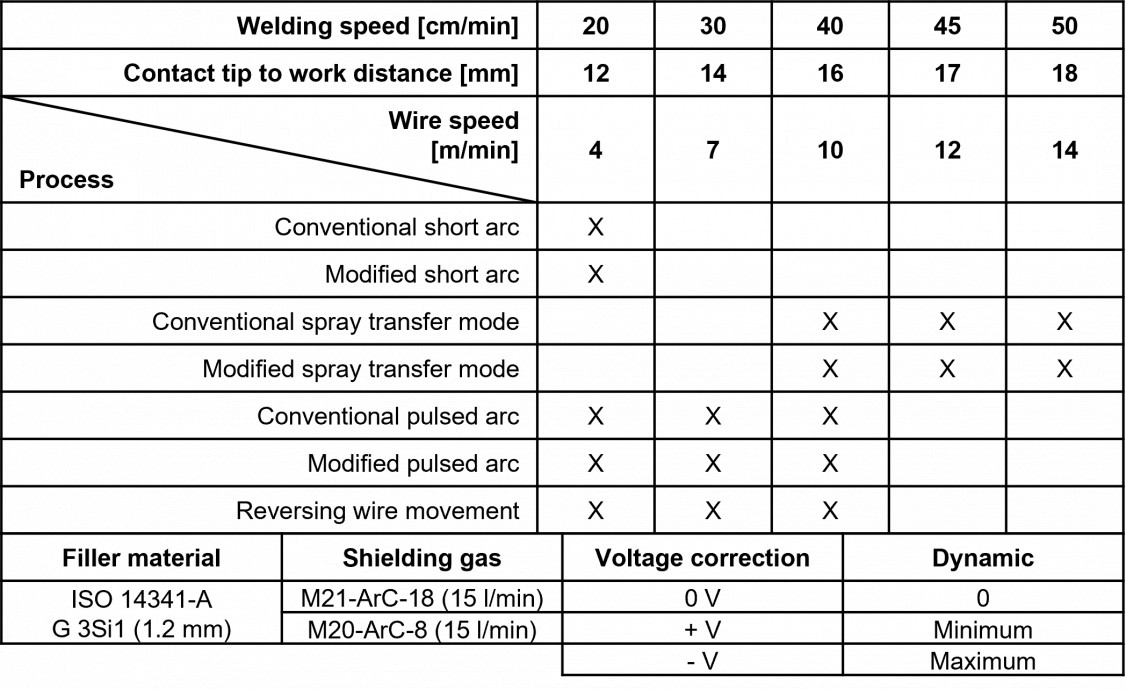
A fume chamber based on DIN EN ISO 15011-1 was used to collect the welding fumes. With this method, all of the welding fumes released are extracted through a filter paper, where they are deposited and their mass is determined gravimetrically. The standard deviation of the welding fume emission rate determined for this measurement method is low, as statistical preliminary investigations show [7], so that the determined values can be regarded as reliable. At the same time, the welding current and voltage are recorded transiently for subsequent analysis. The analysis of the electrical measurement data was primarily limited to calculating the average voltage, average power and short-circuit rate of the individual process variants, as these parameters show the strongest correlation with the FER [7]. All welds were carried out fully mechanised on a water-cooled linear welding table, with the process being triggered externally in order to create comparable boundary conditions. The base material used was bare (uncoated) S235 structural steel in welding position PA with a neutral torch angle. Torch position and orientation as well as welding times could therefore be set with repeatable accuracy [11].
3 Results and Discussion
3.1 Short arc mode
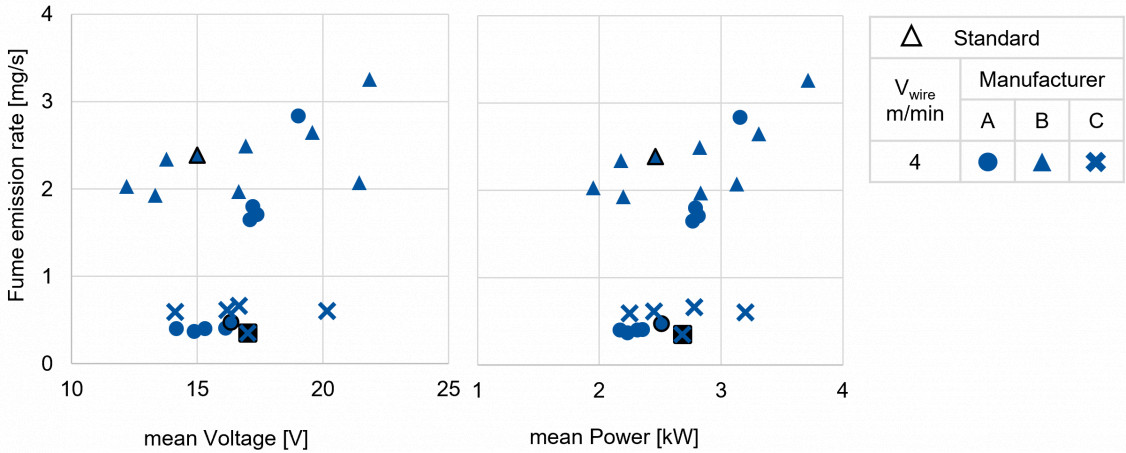
A total of three short arc processes (SAP) were investigated, comprising one conventional SAP and two modified SAPs from three different power source manufacturers. In order to determine the process settings for a minimum FER, the results of the individual welds were plotted in a FER diagram. Fig. 1 shows the results for the FER over the average voltage (left) and over the average power (right). The average voltage and the average power were used for the evaluation, as these show the strongest correlation with the FER. The processes from manufacturers A and F are modified SAP processes in this case, and the process from manufacturer B is the conventional process. The measurement points with a border each represent the standard process without voltage and dynamic correction. The conventional process achieves a minimum FER of approx. 1.8 mg/s when the voltage is varied. In contrast, the modified SAP processes can achieve a lower FER of approx. 0.4 mg/s. For the modified SAP from manufacturer A, it can also be seen that the FER increases when the voltage is increased. Something similar can also be observed for the conventional process. Accordingly, the modified SAP processes can behave similarly to a conventional process when the voltage is increased. However, the modified processes achieve a lower FER at the same average voltage. The dependence between the average power and the FER is somewhat more pronounced. Accordingly, in these process variants the strongest correlation in the power range under consideration occurs between the FER and the electrical power. It is particularly interesting that the modified processes achieve lower FER values than the conventional process at the same average power. This suggests that, in the modified process variants, the specially controlled current flow and the resulting optimised material transfer have a significant effect on the FER at the same average power [7; 12; 13]. It should be noted here that these are not processes with reversing wire movement.
3.2 Spray transferred mode
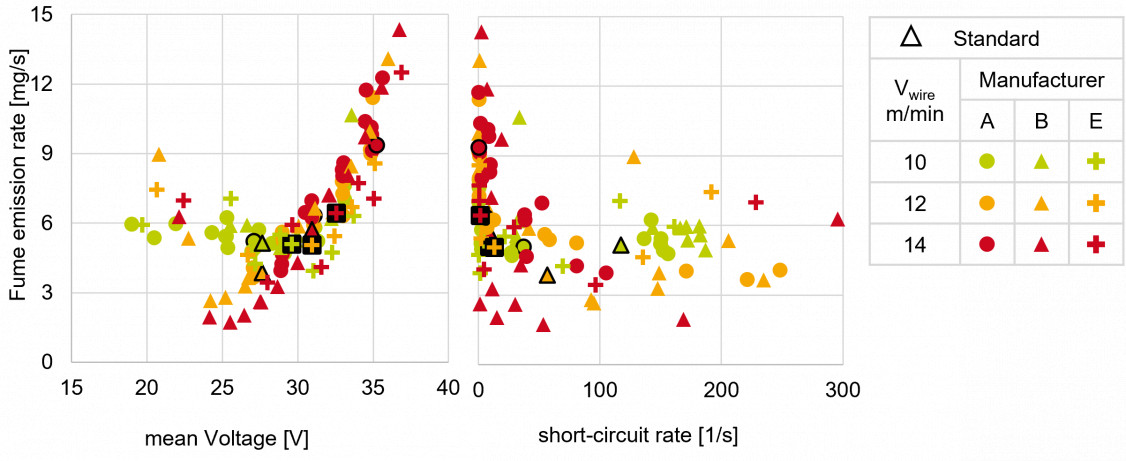
The same procedure was followed for the spray transferred mode variants (STM variants). In each case, the FER was examined and the current and voltage records were evaluated individually in order to determine process-specific parameters. In addition, welding speeds and contact tip-to-work distances corresponding to the process power were defined. Two modified STM processes (manufacturers A and E) and one conventional process (manufacturer B) were examined. Fig. 2 shows the results for these three process variants, with the conventional process shown as a bordered shape. Compared to the SAP process, the measurement points are generally at a higher FER level, with higher average voltages being measured. When the wire feed speeds of 12 and 14 m/min are considered in the range between 24 V and 27 V, a minimum of the FER can be observed. This appears to be similar for all process variants considered. At a wire feed speed of 10 m/min and a voltage below 30 V, a constant FER of approx. 5 mg/s is measured. Above a voltage of approx. 30 V, there is no further increase in the FER with increasing wire feed speed. This leads to the initial conclusion that, above a certain average voltage, the wire feed speed plays a subordinate role with regard to welding fume emissions. The short-circuit rate on the right-hand side of Fig. 2 shows the number of short-circuit events in the voltage record. For this purpose, each voltage drop below a threshold value was determined, summed up and normalised to time. In this case, these are not discrete short circuits with low electrical resistance, as occur in the SAP process, but rather short-lived material bridges that exist for a few milliseconds and then dissolve again. Because of this particularity, the term micro short circuits is used in this context. The low-FER range for the wire feed speeds of 12 and 14 m/min shows short and sporadic micro short circuits with a rate between 10 and 150 1/s. If the voltage is reduced further, the number and, above all, the length (not shown here) of the micro short circuits increase and severely disturb the process. As a result, the FER rises again for low voltages. For the wire feed speed of 10 m/min, the number and length of the short circuits likewise increase when the voltage is reduced. The low FER for the processes with a wire feed speed of 12 m/min and 14 m/min can be explained by an arc burning deep in the workpiece. The resulting cavity improves the possibilities for condensation of the metal vapor in the weld pool and thus reduces the proportion that can escape into the surroundings. This can also be observed when welding in a groove. When the standard settings of the individual process variants are considered, it is noticeable that there is enormous potential for reducing fume emissions, particularly for the wire feed speeds of 12 and 14 m/min.
3.3 Pulsed arc
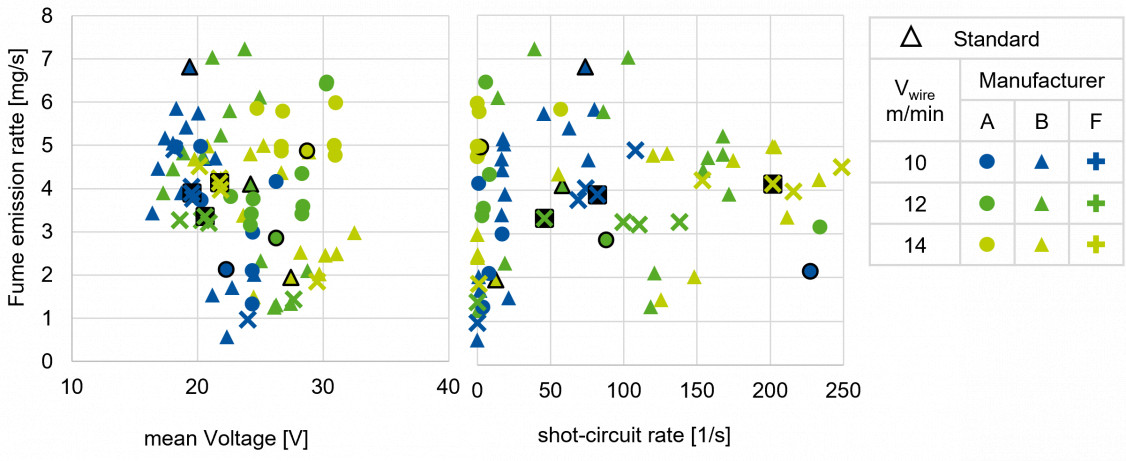
As a third category, two different modified pulsed arc processes (PA processes) from manufacturers A and F as well as one conventional PA process from manufacturer B were examined. For the PA processes, too, the FER was plotted over the average voltage and the short-circuit rate. Fig. 3 shows the results for these process variants. On the left-hand side of the graph, it can be seen that the FER can vary greatly at the same average voltage and that there appear to be further influencing variables. On closer inspection, two ranges can be identified, with one range forming for higher FER and the other for lower FER. The higher-emission range lies approximately between an average voltage of 15 to 32 V and an emission rate of 3 to 8 mg/s. The lower-emission range is delimited diagonally downward toward higher voltages. The measurement results lie in a range between 20 and 33 V and between 0.4 and 3 mg/s. When the evaluation of the short-circuit rate in the right-hand diagram is considered, it can be seen that the lower-emission range predominantly exhibits a low number of short circuits. It can therefore be assumed that, for a given wire feed speed, the PA process tends to require a higher voltage in order to achieve low welding fume emissions. The higher voltage produces no or few short circuits, as a result of which the process has a particularly clean droplet detachment and only small amounts of welding fume are produced. This is also externally recognizable from a longer arc length. This effect can be observed for all wire feed speeds considered; however, the FER increases with higher wire feed speed and corresponding power. It is therefore all the more important to exploit the process-specific potential of an FER-optimized setting. This is particularly evident here, since most of the standard settings of the synergy curves lie in the range that exhibits higher emission values.
3.4 Reversing wire movement
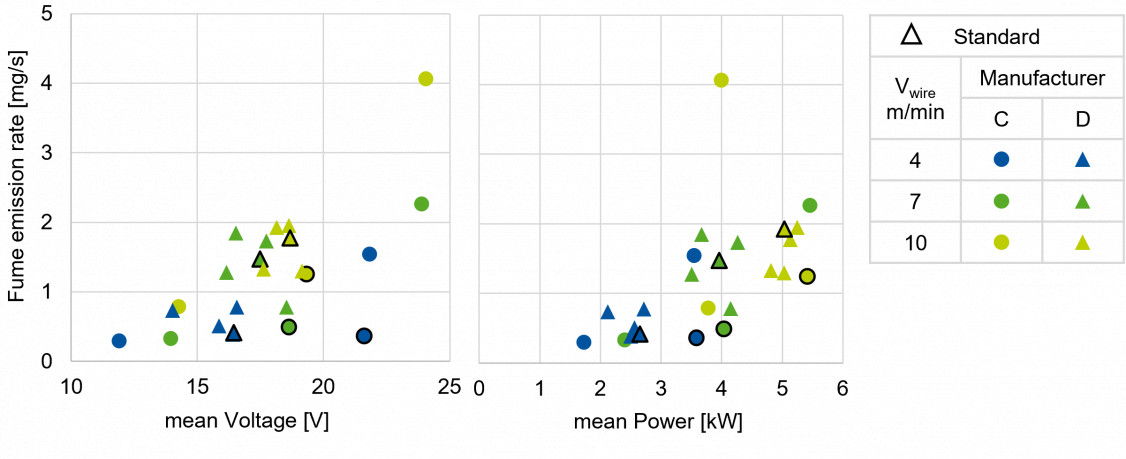
The fume emission results of two processes with reversing wire movement from two different manufacturers are shown in Fig. 4. Since these process variants are very similar to the SAP processes, the average power was again included in the evaluation as a second variable. For this comparison, the wire feed speed was specified as a fixed variable and the voltage correction was varied; the stored synergy curve then determines the current and voltage from this. Compared to other process variants, the FER for these processes is particularly low over the range considered, with an average value below 2 mg/s. This is particularly noticeable when reference is made to the wire feed speed. The process from manufacturer C reacts more strongly to the voltage correction and shows a greater dispersion of the resulting FER values than the process from manufacturer D. The process from manufacturer D could not be brought above a value of 2 mg/s by adjusting the voltage correction. The average electrical powers of the two processes are comparable with respect to the standard parameters and the set wire feed speed. However, for manufacturer C, an electrical power approximately 1 kW higher results for the operating point of 4 m/min.
3.5 Comparison of the weld seam geometry for bead-on-plate welds in the flat position
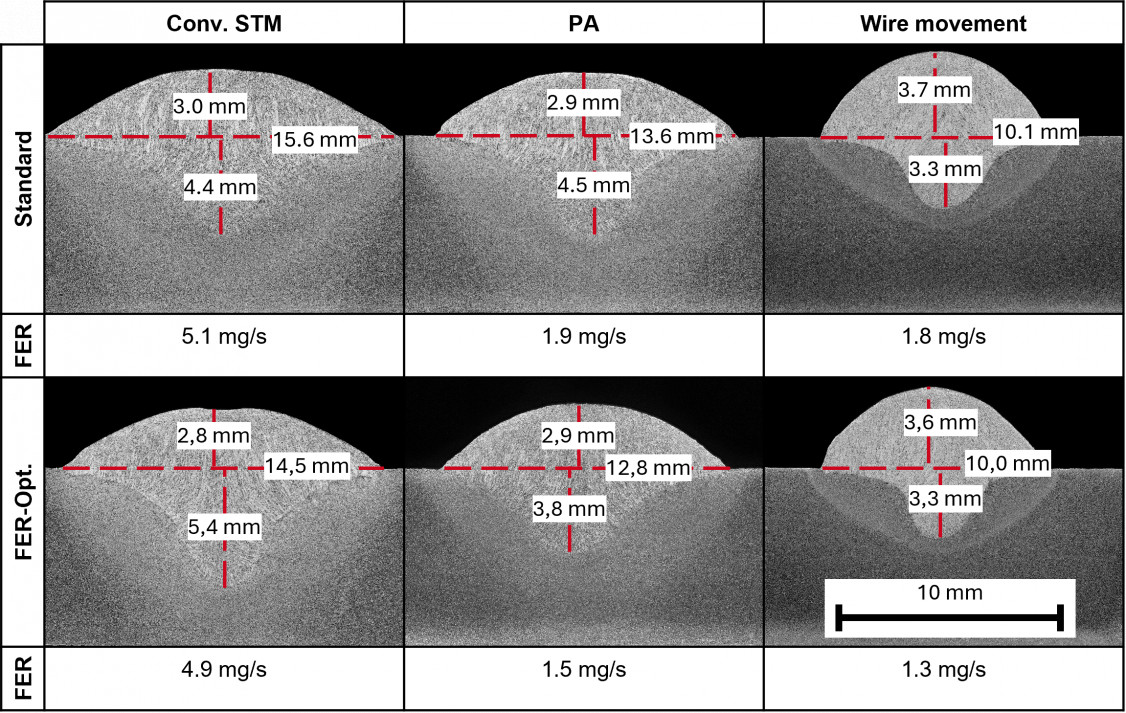
In order to obtain a cross-process assessment of the welding fume emissions, three process variants were compared at a wire feed speed of 10 m/min. Table 2 shows six cross-sections of bead-on-plate welds; on the left a conventional STM process, in the middle a conventional PA process and on the right a process with reversing wire movement. The upper images show cross-sections of welds without correction of the voltage or the dynamic. The lower row of images shows sections of the welds that were parameterized in the arc correction such that the FER is minimized. When comparing these welds, however, not only the FER must be taken into account but also the change in the weld seam geometry. In addition, each process control variant offers different potential for reducing fume emissions through adjustment of the synergy parameters, as well as different upper levels which, due to the process characteristics, are not exceeded even with the standard settings. In this study, the comparison was drawn at a wire feed speed of 10 m/min. For the spray transferred mode process, previous investigations have shown that the minimisation potential is considerably greater at higher wire feed speeds (≥12 m/min).
If only the FER values are compared, it is noticeable that the lowest emissions originate from the PA and from the process with reversing wire movement. However, the process with reversing wire movement achieves the lowest values. The minimization potential can be expressed as a percentage reduction of the FER. At a wire feed speed of 10 m/min, this results in a reduction of approx. 6 % for the conventional STM process, approx. 21% for the PA process, and approx. 28% for the process with reversing wire movement. The examination of the weld seam geometry shows a difference in penetration, particularly for the conventional STM. As with all preceding results, it should be noted here that all results depend strongly on the synergy curves stored in the power sources. Accordingly, a different current flow at the same average current and voltage in the pulsed process can lead to an altered seam profile. Due to the special process control of the reversing wire movement, the penetration is somewhat lower and the seam somewhat higher than for the other process variants. Since the wire feed speed was set identically for all welds, the result is a narrower seam. Back-calculating the wire feed speed via the area of the weld reinforcement, assuming constant volume, shows that the effective wire feed, contrary to the set value, varies between 8.7 and 10.8 m/min. Since the actual time profile of the wire feed speed was not determined in the project, the precise cause of this cannot be ascertained. However, it is known from earlier investigations that, for certain power source types and process variants, control interventions to stabilize the process can lead to a deviating actual wire feed speed. Since the seam surface exhibits no coarse rippling and no other irregularities, this appears to be a plausible cause.
For the power range of up to 10 m/min under consideration, it is therefore apparent that, depending on the welding task, either a PA or a process with reversing wire movement should preferably be selected. Here, the required weld seam geometry is the decisive factor. With the PA, a seam geometry comparable to that of the STM can be achieved while at the same time significantly reducing the emission. As soon as higher wire feed speeds can be considered, it is advisable to include the STM process again in the evaluation owing to its higher minimization potential. It should be noted that, at higher wire feed speeds, the PA increasingly loses the character of a PA process and the material transfer becomes more and more similar to that of an STM process.
3.6 Comparison of the shielding gases M20-ArC-8 and M21-ArC-18
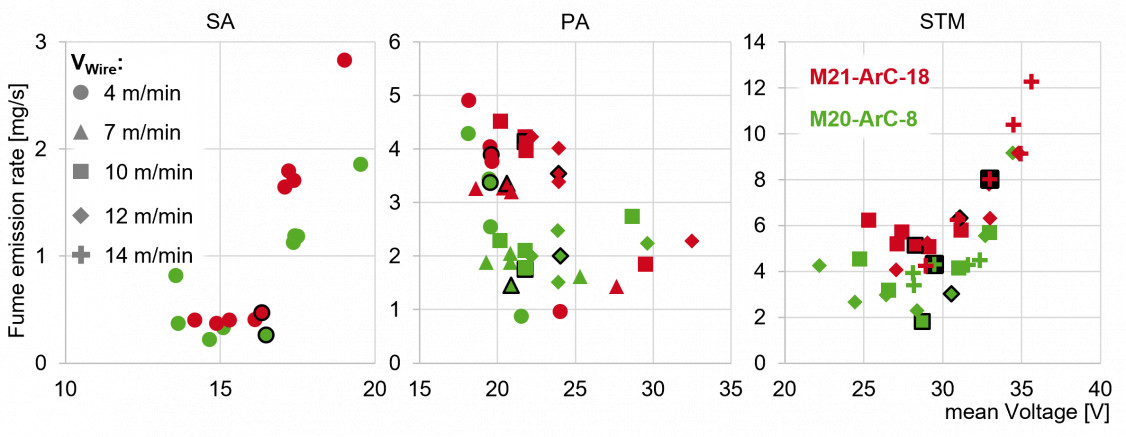
In addition to the investigations with the shielding gas M21-ArC-18, tests were also carried out with the shielding gas M20-ArC-8 in order to determine the influence of a smaller CO2 content. The results are shown comparatively in Fig. 5. The figure distinguishes between the three metal transfer modes SAP, PA, and STM. Modified process variants from one manufacturer were used for this test series. Overall, the FER for all processes shifts toward lower values when M20-ArC-8 is used [14]. The changed shielding gas has the strongest effect on the processes with higher power. Due to the adjusted scaling of the individual diagrams, the impression arises that lower values can also be seen for the SAP process. However, the deviations are so small that they may lie within the range of measurement scatter. For the PA and STM processes, the effect of a reduced CO2 content is considerably more pronounced. Using the shielding gas M20-ArC-8, the PA process now forms only a single range with lower FER. As a result, the FER for this process is halved on average. The STM process likewise achieves a lower FER with the other shielding gas. For this process, too, an approximate halving of the FER can be achieved on average. Accordingly, for processes with higher power, the CO2-reduced shielding gas offers high potential for reducing the FER.
4 Conclusion
The results clearly show that modified short arc processes can achieve significantly lower FER values than conventional variants. These advantages can be attributed primarily to optimised current flows and the resulting improved material transfer, without the need for processes with reversing wire movement. For the spray transferred mode and pulsed arc processes, too, it is possible to adjust the process in an FER-optimized manner. Here, significant reductions could be achieved in particular by adjusting the voltage correction and the dynamic. For the PA process, it is therefore necessary to set a short-circuit-free process, which tends to be the case at higher voltages than in the standard process. This enables a clean droplet detachment and a trouble-free process. It is also interesting to note that, from a wire feed speed of 12 m/min, the FER in the STM process can be significantly reduced if the voltage is brought into a range between 24 and 27 V. Accordingly, the voltage must tend to be reduced compared with the standard settings. Processes with reversing wire movement exhibited particularly low FER values over the entire range examined. The direct comparison of different process variants at identical wire feed speed furthermore demonstrates that not only the absolute emission level differs but also the respective potential for further minimization varies from process to process. A further important aspect concerns the choice of shielding gas. By using a CO2-reduced gas (M20-ArC-8 instead of M21-ArC-18), a halving of the FER could be achieved, particularly for higher-power processes.
In summary, it becomes clear that the individual process variants offer different minimisation potentials. Moreover, processes that fall into the same category sometimes differ greatly from one another. This is due, among other things, to the fact that, even for the conventional processes, there are significant differences in the synergy curve, resulting in different operating points – caused by influencing factors such as the welding consumable and shielding gas, the torch distance and orientation and, not least, the person who develops the synergy curve. These factors, which are interrelated in a complex manner, make a comprehensive evaluation of the results more difficult. Nevertheless, ranges in which the FER is particularly low can be identified for individual process variants. For practical application, concrete recommendations can be derived from this: in the lower power range (up to about 10 m/min wire feed), depending on the required weld seam geometry, a pulsed arc or a process with reversing wire movement should be preferred, since with these a weld seam geometry comparable to that of the spray transferred mode can be achieved at significantly lower emission. If higher wire feed speeds are required, the spray transferred mode gains in importance owing to its greater minimization potential. Since the low-emission operating points differ between power sources because of the differing synergy curves, they must be verified for the specific power source prior to application; the process windows identified in this work provide an application-oriented selection aid for this purpose.
5 Acknowledgement
IGF project no.: 01IF22017N / DVS no.: Q6.3429:
The project was funded by the German Federal Ministry for Economic Affairs and Energy on the basis of a resolution of the German Bundestag.
The project was carried out by the Research Association for Welding and Allied Processes (Forschungsvereinigung Schweissen und verwandte Verfahren e.V.) of the DVS, Aachener Strasse 172, 40223 Duesseldorf.
Authors: Uwe Reisgen, Rahul Sharma, Mirco Olesch, Konrad Mäde, Benjamin Ebert
References
[1] Ausschuss für Technik im DVS. TRGS 900 - Arbeitsplatzgrenzwerte.
[2] Ausschuss für Technik im DVS. TRGS 910 - Risikobezogenes Maßnahmenkonzept für Tätigkeiten mit krebserzeugenden Gefahrstoffen.
[3] Reisgen, U., et al.: Vergleichende Schweißrauchuntersuchungen zwischen konventionellen und digital geregelten MSG-Schweißprozessen im Pulsmodus. DVS Congress 2019: Große Schweißtechnische Tagung 2019.
[4] Rose, S.; Ansätze zur Enstehung und Reduzierung von Schweißrauchemissionen beim MSG-Schweißen unter Berücksichtigung neuer Verfahrensvarianten 2012.
[5] Rose, S.: Entstehung und Reduzierung der Schweißrauchemissionen beim MSG-Schweißen – Ergebnisse des 1. EWM-Awards. DVS-Berichte, Band 275 2011.
[6] Quimby, B.J., u. Ulrich G.D.: Fume Formation Rates in Gas Metal Arc Welding A New Fume Chamber Design Improves the Accuracy of Fume Generation Data 1999.
[7] Reisgen, U., et al.: Method Development of Statistical Modeling for the Description of Welding Fume Emissions in Gas Metal Arc Welding Using Transient Process Characteristics. Weld World 2020;64(9):1497–502. https://doi.org/10.1007/s40194-020-00924-0.
[8] Ausschuss für Gefahrstoffe. TRGS 528 - Schweißtechnische Arbeiten.
[9] Ausschuss für Technik im DVS. Merkblatt DVS 0973-1 - Übersicht der Prozessregelvarianten des MSG-Schweißens; 2019.
[10] DIN EN ISO 14175: Schweißzusätze – Gase und Mischgase für das Lichtbogenschweißen und verwandte Prozesse 2008.
[11] DIN EN ISO 15011-1: Teil 1 – Bestimmung der Rauchemissionsrate beim Lichtbogenschweißen und Sammeln von Rauch zur Analyse 2010.
[12] Ioffe, I., et al.: Fume Formation Rate at Globular to Spray Mode Transition During Welding. J. Phys. D: Appl. Phys. 1995;28(12):2473–7. https://doi.org/10.1088/0022-3727/28/12/013.
[13] Chae, H., et al.: Fume Generation Behaviors in Short Circuit Mode during Gas Metal Arc Welding and Flux Cored Arc Welding. Mater. Trans. 2006;47(7):1859–63. https://doi.org/10.2320/matertrans.47.1859.
[14] Pires, I., et al.: Reduction of Fume and Gas Emissions Using Innovative Gas Metal Arc Welding Variants. Int J Adv Manuf Technol 2010;50(5-8):557–67. https://doi.org/10.1007/s00170-010-2551-4.
Schlagworte
Emission ControlEmission ReductionGas Metal Arc WeldingGMAWResearch PaperWeldingWelding ArcWelding FumesWire FeedWire Feed SpeedWorkplace Safety