15.12.2025
Fachbeitrag
Forschung
 machine setup, (b) horn geometry, (c) joining partners - © Technische Universität Chemnitz")
Ultrasonic metal welding (USMW) is increasingly employed for joining electrical conductors, especially in the context of lightweighting strategies that involve replacing copper with aluminum. This makes the technique highly relevant across sectors such as automotive and aerospace. However, USMW still suffers from limited process transparency. In current industrial practice, weld quality is primarily verified through selective destructive testing. As a result, it is neither feasible to inspect every joint nor to avoid false classifications, leading to both unnecessary rejects and undetected defective welds. This contribution presents a machine learning (ML)-based approach to enable real-time process monitoring using data directly obtained from the welding system. By leveraging signal characteristics captured during welding, the system not only distinguishes between “OK” and “NOK” welds but also enables a detailed categorization of defect types. In addition, a predictive model for pull-out force was integrated, allowing quantitative assessment of weld integrity without physical testing. Validation results show a classification accuracy of 99.9% and a mean absolute error for regression of 75 N, demonstrating the method's potential to enhance process reliability while significantly reducing both scrap and test effort. The approach lays the groundwork for data-driven quality assurance in USMW and supports the implementation of robust inline monitoring.
1. Introduction
Ultrasonic metal welding (USMW) is a solid-state joining technique that utilizes high-frequency mechanical vibrations to create a metallurgical bond between metallic components without melting the base materials. The process involves the application of oscillatory shear motion, typically at frequencies between 20 and 40 kHz, combined with a moderate clamping force, which generates frictional heat and facilitates material interlocking and diffusion at the contact interface [1–4]. USMW has become an established technology in industries such as automotive, aerospace, consumer electronics, and energy, particularly for the joining of stranded wires to terminals and busbars in wire harnesses as well as battery and power distribution systems [5]. The key advantages of USMW include short cycle times, high energy efficiency, and the absence of filler materials, fluxes, or shielding gases. Moreover, the ability to join dissimilar metals, such as aluminum to copper, makes USMW particularly attractive for modern lightweight electrical systems [6, 7]. The process is also compatible with automation and suitable for high-volume production. However, several challenges limit the robustness of USMW in industrial practice. These include sensitivity to surface conditions (e.g., oxide layers, contamination), variability in material behavior (e.g., wire strand flexibility, terminal geometry), and a relatively narrow process window that must be tightly controlled to ensure reliable weld quality [8–10]. Due to the solid-state nature of the process, traditional melt-related quality indicators such as nugget formation or fusion zone geometry are absent. As a result, quality assurance in USMW relies heavily on indirect measurements such as pull tests, resistance checks, or subjective visual inspection. These methods are often destructive, sample-based, and unable to provide real-time feedback, which leads to pseudo-rejects and undetected defects in serial production environments [11]. In industrial environments, process monitoring for ultrasonic metal welding is typically limited to destructive sample testing and the monitoring of scalar machine outputs such as welding time, maximum generator power, or horn displacement. These values are often compared against fixed threshold limits defined by customer specifications or internal quality standards. Although some modern welding systems offer extended logging capabilities, including time-resolved data, their potential for detailed weld analysis remains largely untapped. Notably, several companies reported continued occurrence of undetected defective welds and false rejects, despite existing controls, indicating the limited effectiveness of current monitoring strategies [12, 13].
A broad spectrum of scientific approaches has been proposed to enhance process monitoring in USMW, addressing the limitations of scalar threshold monitoring and sample-based destructive testing. One prominent research direction involves the use of external sensor systems to capture dynamic process signatures in real-time. Laser vibrometry, for example, has been employed to measure oscillation behavior of the anvil and horn, enabling indirect inference on bonding stability and interface friction. These studies have revealed that subtle changes in vibration amplitude or frequency composition correlate strongly with shifts in process parameters, weld quality, and defect occurrence [14–17]. Thermographic methods have also been applied to monitor heat generation in the joining zone. Investigations have shown that significant thermal gradients occur at the contact between the upper joining partner and the horn, offering a potential indicator for improper coupling or contamination [18, 19]. While these methods are insightful, their implementation in industrial settings remains challenging due to equipment complexity, sensitivity to ambient conditions, and high integration costs. Acoustic emission (AE) monitoring has emerged as another technique to trace frictional and bonding events during welding. By analyzing AE signal intensity, frequency content, and signal rate, researchers have attempted to classify bonding phases and detect anomalies such as premature tool lift-off or inconsistent wire compaction. Complementary to AE, frequency domain analysis methods such as short-time Fourier transform (STFT) and total harmonic distortion (THD) have been used to identify non-linearities in the tool–workpiece interaction indicative of faulty bonding [20–22]. Still, many of the more advanced sensor approaches remain confined to laboratory environments due to robustness and cost limitations, highlighting the need for methods that leverage existing infrastructure to enable real-time decision support in serial production. Furthermore, the integration of such sensor systems into existing production lines is challenging due to space constraints, contamination risks, and the need for real-time data processing. Consequently, there remains a clear need for a cost-effective, inline-capable monitoring approach that leverages existing machine data and enables automated classification of weld quality across a broad range of fault types [22–24].
Beyond USMW, adjacent welding domains have articulated complementary Industry-4.0 perspectives that emphasize in-process monitoring and data analytics. For laser-welded blanks, response-surface modeling has been used to quantify parameter influence on downstream forming and to optimize process windows [25]. Building on this, a critical review proposed an intelligent ALWB factory model integrating sensing, analytics, and cyber-physical feedback [26], while a strategic roadmap toward smart laser welding outlined IoT connectivity, continuous monitoring, and big-data analytics as enablers of scalable and sustainable manufacturing [27]. Although laser-specific, these works underline a general trend toward inline, sensor-informed welding systems. Similar trajectories exist in friction stir welding, where machine-integrated signals such as force, torque, and power have been exploited for monitoring and control [28].
Motivated by these developments and to address the challenges in the field of USMW, this study presents a machine-learning approach for real-time process monitoring in ultrasonic metal welding that requires no external instrumentation. Prior USMW monitoring has predominantly used external sensors (including laser-Doppler vibrometry to track bonding stages, airborne/structure-borne acoustic emission for defect detection, and high-speed imaging or thermography to observe interfacial motion and heat generation), powerful in laboratories but integration-intensive and sensitive to ambient conditions, which limits routine industrial use. In contrast, only time-resolved internal machine signals natively recorded by off-the-shelf welding units are used, eliminating retrofitting, external triggers, and data synchronization [29, 30]. Therefore, the proposed system solely uses recorded values for generator power, horn displacement, and welding force. The approach focuses on two primary objectives: First, to develop and evaluate a classification model capable of distinguishing between different weld fault types, such as contamination, misalignment, and clamping errors, based exclusively on machine data. Second, to assess the predictive capabilities of these signals with respect to mechanical joint strength, aiming for a non-destructive substitute for pull-out testing. To achieve this, a set of intentionally induced fault types was defined and realized under controlled conditions. This set of fault types was chosen for representativeness in series production and to cover distinct root-cause families that recur in cable harness manufacturing. The selection was informed by structured consultations with multiple cable-harness manufacturers within an industrial collective-research context:
- Geometric positioning: Wire and terminal misalignments reduce effective overlap and compaction. Recent studies highlight the sensitivity of USMW to joint geometry and exact welding position. Additionally, industry guidance emphasizes the controlled placement of strands and terminals [31, 32].
- Surface conditions: Contamination (e.g. oils, oxides, residual coatings) are known to degrade mechanical and electrical performance, which is explicitly reflected in USCAR-38 [33] and recent investigations of surface-condition effects for wire/terminal joints [34, 35], as well as the general requirements in IEC 60352-9 [36].
- Tool condition: Tooling wear (e.g. horn or anvil wear and mechanical play in the oscillation stack) alters energy transmission and contact mechanics and is repeatedly linked to weld-quality drifts. Dedicated studies and maintenance guidance document the quality impact and motivate tool-condition monitoring in USMW [37, 38].
Taken together, misalignment, contamination, and tooling wear represent three principal failure families in industrial USMW that are practically inducible under controlled conditions and relevant for monitoring approaches. For determining robust welding parameters and for generating reproducible training date, a central composite face-centered experimental design (CCF-DoE) was used. In addition to classification and strength prediction, this work critically examines the use of pull-out force strength as a quality metric by comparing it to the electrical performance of the joints, specifically their ampacity. Through metallurgical analysis and high-current testing, the validity of pull-out force as a proxy for functional performance is reevaluated. The following sections detail the experimental setup, the machine learning workflow, and the evaluation of the models developed. The results demonstrate that reliable weld classification and strength prediction are achievable using existing machine data, offering a cost-effective and industry-ready solution for inline quality monitoring in USMW.
2. Experimental setup
All welding experiments were carried out on an ultrasonic metal welding system MT8000 from Telsonic, shown in Fig. 1a, operating at 20 kHz with a maximum generator power of 10 kW and a maximum welding force of 8 kN. The oscillation stack consisted of a piezoelectric converter, a booster, and a horn optimized for joining stranded aluminum conductors. The horn featured a maximum tip amplitude of 34 µm and a wave-like geometry suitable for ensuring sufficient energy transmission and effective mechanical interlocking in wire/terminal welds. The horn geometry is shown in Fig. 1b.
The upper joining partners used in all trials were aluminum automotive wires with a nominal cross-section of 50 mm², consisting of 247 individual strands with a maximum diameter of 0.52 mm per strand. The insulation material was polyvinyl chloride (PVC). The terminals were made of Cu-ETP and had dimensions of 50 x 22.5 x 3 mm². The edge of the terminal which would be in contact with the wire during welding, was broken with a radius of 2.5 mm to prevent strand damage during the USMW process. Both joining partners are shown in Fig. 1c. In all welding trials, the stripped length of the aluminum conductors and the positioning of the terminals were standardized using a custom fixture to ensure consistent spatial alignment. This fixture also enabled reproducible placement within the welding zone and minimized variation due to handling or part tolerances. The setup was chosen to represent realistic production conditions while allowing systematic variation of process parameters and introduction of controlled weld faults.
 machine setup, (b) horn geometry, (c) joining partners - © Technische Universität Chemnitz")
To generate a robust dataset for training and evaluating the machine learning models, a central composite face-centered experimental design (CFF-DoE) was applied. The design varied the three main process parameters: ultrasonic amplitude, welding pressure, and welding energy across three levels. The objective was to identify a parameter combination that yields maximum pull-out forces. The resulting response surface was fitted using a third-order polynomial model, which revealed a characteristic saddle surface. As this saddle led to multiple optima, the parameter set was selected, that provided both high joint strengths, but also a minimum standard deviation, reflecting a process condition with both high mechanical performance and stability. The identified set of parameters consisted of the settings shown in Table 1:

This set of parameters led to an average joint strength of 2,988 ± 81 N and approximate weld times of 1.5 s. The set was then used for generating the baseline welds and all subsequently induced fault types. A corresponding visualization of the response surface is shown in Fig. 2.

Using the selected parameters, 200 welds were produced under nominal conditions to represent the “OK” class. In addition, four different types of welding faults were systematically induced to generate representative “not OK” (NOK) samples. Table 2 lists the weld failure types, which were investigated.

For label assignment, “OK” denotes joints that meet the minimum pull-out force specified for the respective cross-section and material in USCAR-38 [33, 34]. The label “not OK” denotes joints below that threshold. For the aluminum conductor cross-section used in this investigation (50 mm²), a minimum pull-out force of 1,650 N is required by USCAR-38. Each failure type was reproduced in 100 individual welds using standardized procedures to ensure consistency across fault classes. For each weld, process data were acquired directly from the ultrasonic welding system. The system was configured to automatically export an XML header and a time-resolved CSV data file to an external FTP server. The XML file contained system settings and scalar process responses such as maximum generator power, welding time, and total horn displacement. The CSV file included time-dependent measurements of generator power, welding force, and horn displacement sampled at 100 Hz. These datasets formed the foundation for subsequent feature extraction and model training.
For the mechanical characterization of the welded joints, pull-out tests were performed using a ProLine 10 kN universal testing machine from ZwickRoell. Due to the specific geometry and structure of the wire/terminal joints, a customized clamping fixture was developed to ensure reliable and reproducible load introduction. The fixture employed five eccentrically mounted, profiled rollers that engaged the wire insulation without causing damage or slippage of individual strands during testing. This configuration effectively prevented premature failure due to incorrect clamping and enabled robust testing of stranded conductors. The pull-out tests were conducted under displacement control with a test speed of 50 mm/min and a preload of 30 N. Owing to the non-standard geometry of the specimens, strain-controlled testing was not feasible, and extensometers could not be used.
The dataset described above served as the empirical foundation for the s data-driven modelling efforts. To establish a clear, systematic framework for developing the machine learning model, the core of the process monitoring system, and to support interdisciplinary collaboration, the development process was guided by the Cross-Industry Standard Process for Data Mining (CRISP-DM) [39].
Cross-Industry Standard Process for Data Mining (CRISP-DM) [39]. As part of the data understanding, an exploratory analysis of the raw data was performed. Through statistical investigations and the visualization of the curve profiles with respect to various parameters, initial insights into the data structure were obtained.

For each weld, up to 2,400 data points were recorded at intervals of 1 millisecond (ms). An analysis of the target variable reveals an uneven distribution of measurements as shown in Fig. 3. In particular, there are pronounced gaps in the mid-range values, while the majority of values for pull-out force are concentrated between approximately 2,500 and 3,000 N.
For a more in-depth analysis, statistical values of the pull-out force were evaluated separately for the five welding classes, see Table 3.

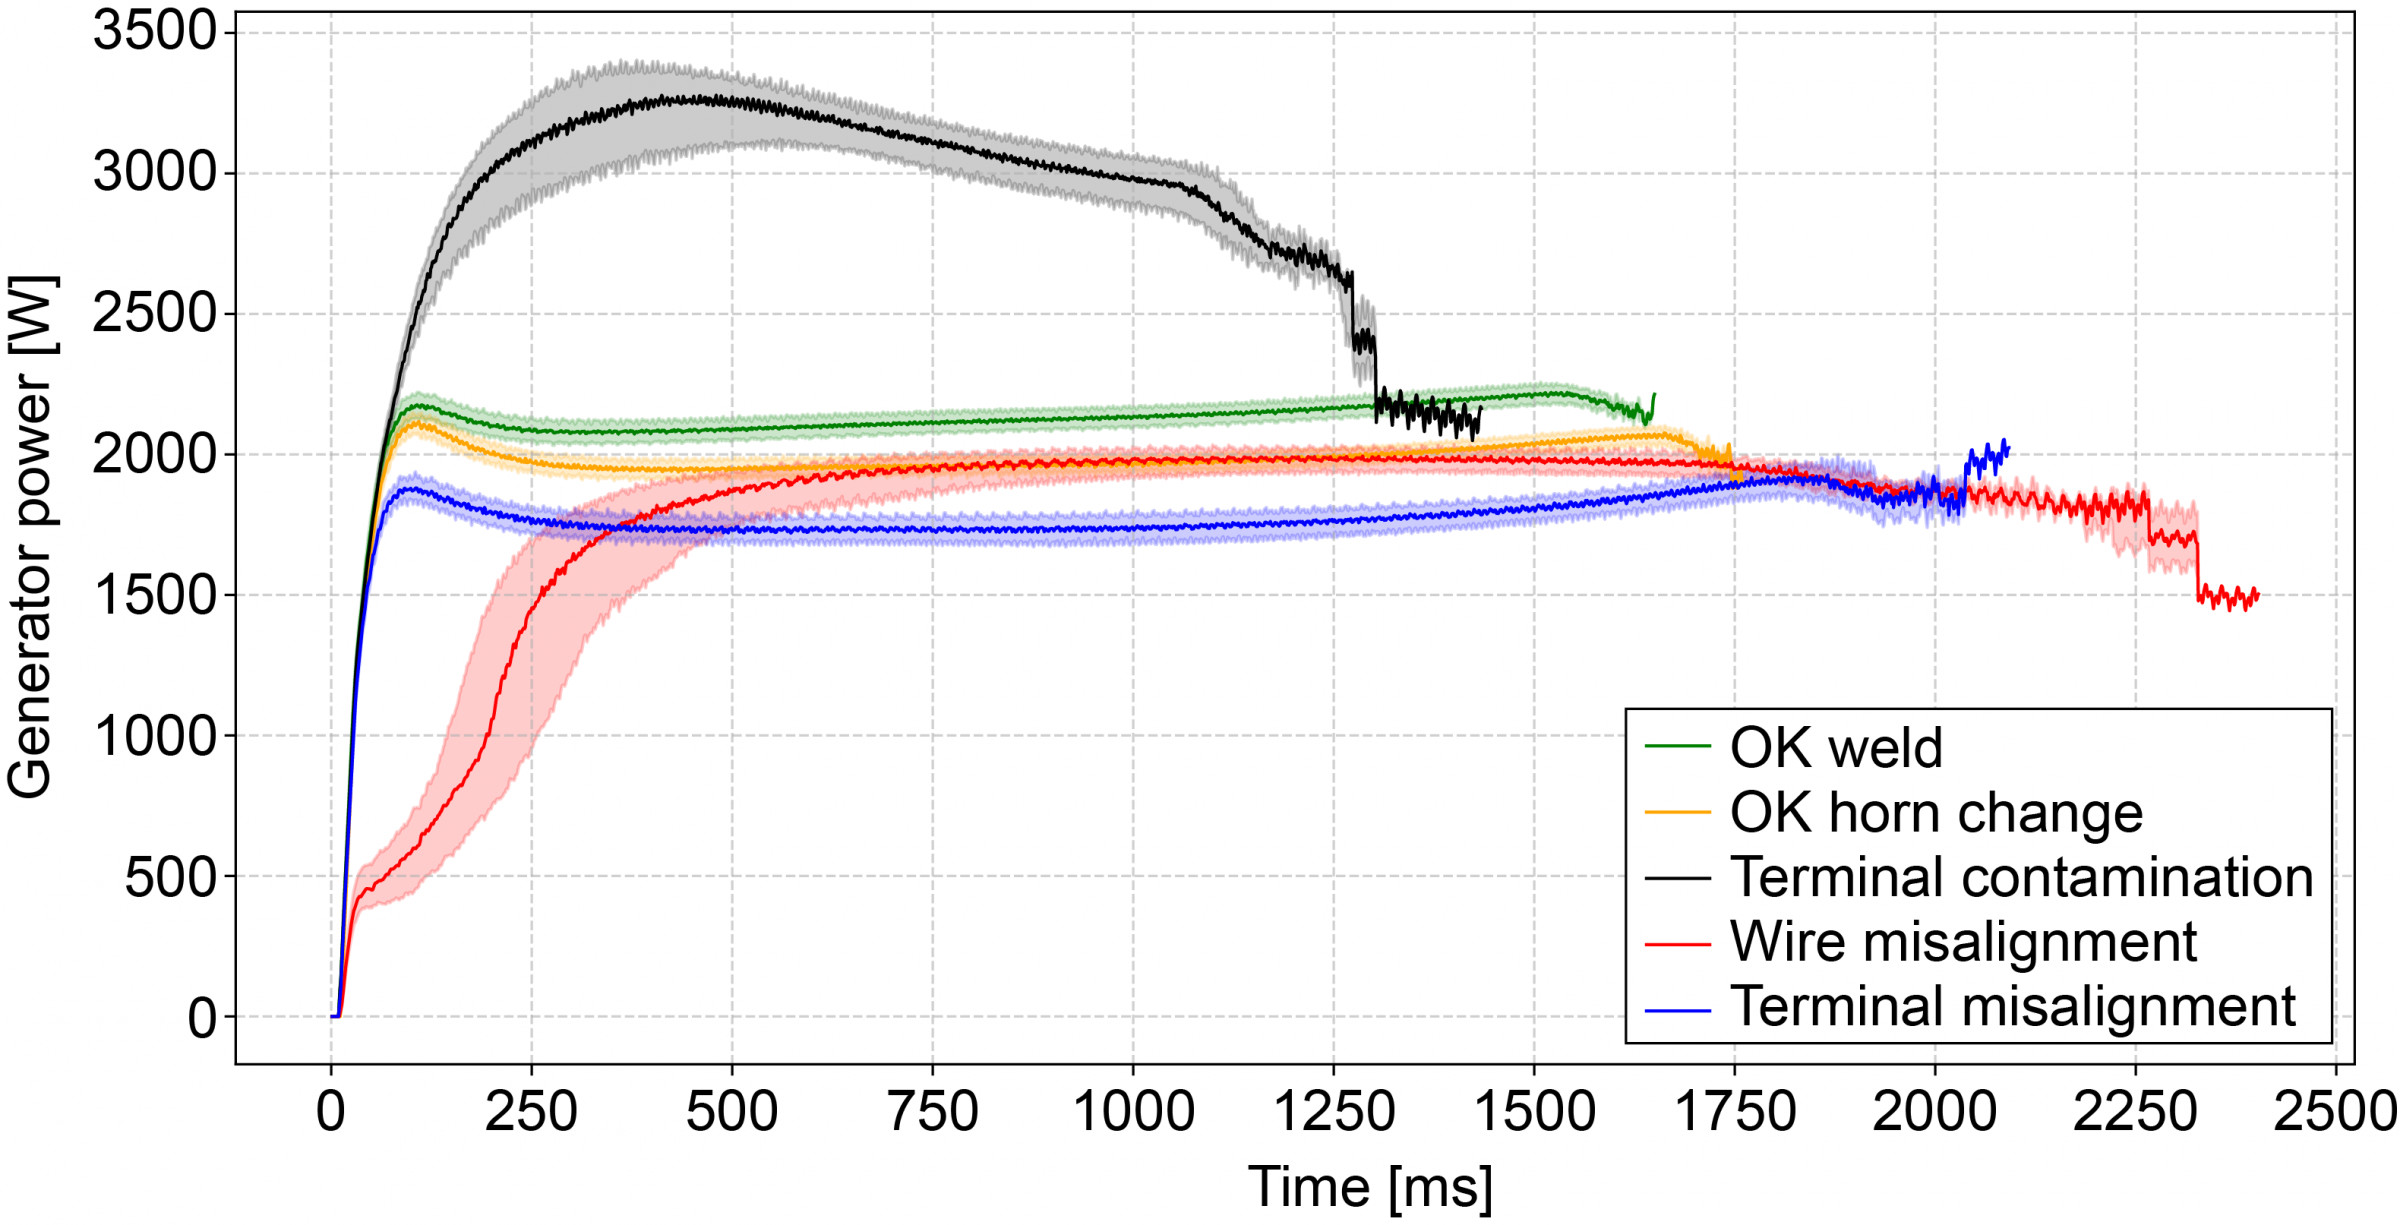
The evaluation shows that the highest pull-out forces, with a median value of 2,850.00 N, was achieved in the OK weld class. This class also exhibits the smallest range (610 N) and standard deviation (108.52 N), indicating high reproducibility and process stability. In contrast, the terminal contamination class shows a significantly lower median value of 247.66 N and a very high spread of 425.79 N. Notably, in a total of 59 cases within this class no pull-out force could be determined resulting from process errors that lead to complete failure of the connection. A visualization of the curve profiles, including the interquartile range of all welding curves in the dataset with respect to generator power and taking class affiliation into account, reveals that the individual welding curves within each class are fairly homogeneous, while there are significant differences between the welding classes, particularly in terms of the curves’ curvature and length, see Fig. 4.
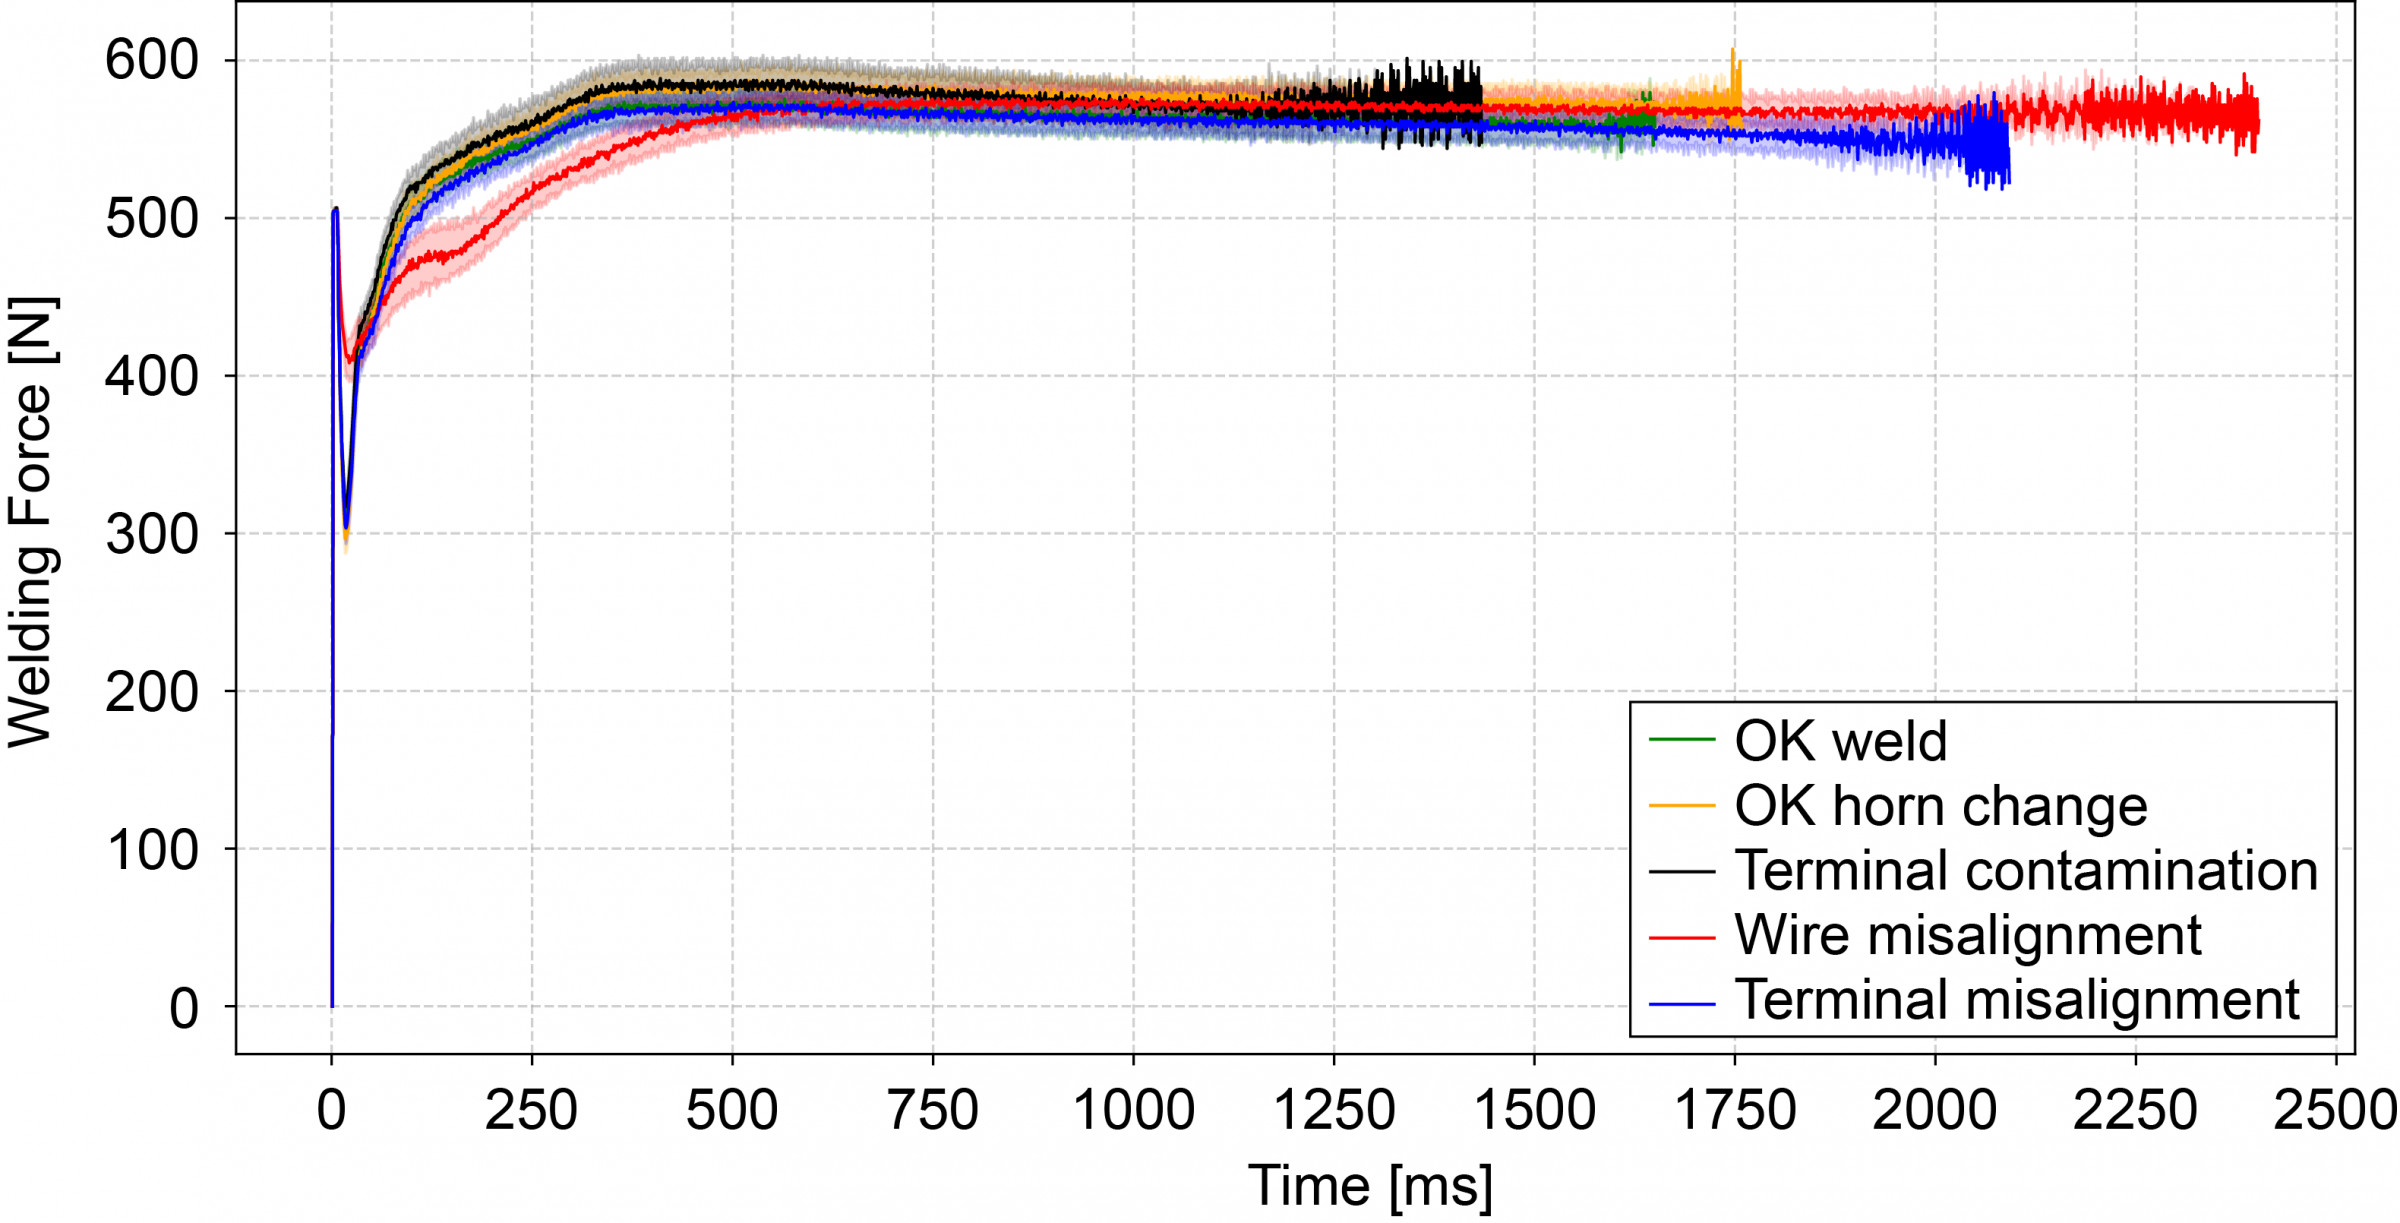
The OK weld class exhibits a uniform profile with a stable plateau, whereas the terminal contamination class shows a sharply elevated energy curve followed by an abrupt termination. The error class wire misalignment also displays a distinctive energy profile, with a shallower rise and overall lower dynamics compared to the OK class. Such profiles indicate process-related deviations and make this feature particularly well suited for distinguishing among the weld classes. The depiction of the welding force profiles, by comparison, shows less differences between the welding classes, see Fig. 5.
Nevertheless, in error types such as terminal misalignment slight dips and more unstable profiles are visible. Although the welding force feature exhibits certain fluctuations, its ability to differentiate between the welding classes is less significant compared to generator power. Examination of the horn displacement reveals a clearer distinction between welding classes than the welding force, see Fig. 6.
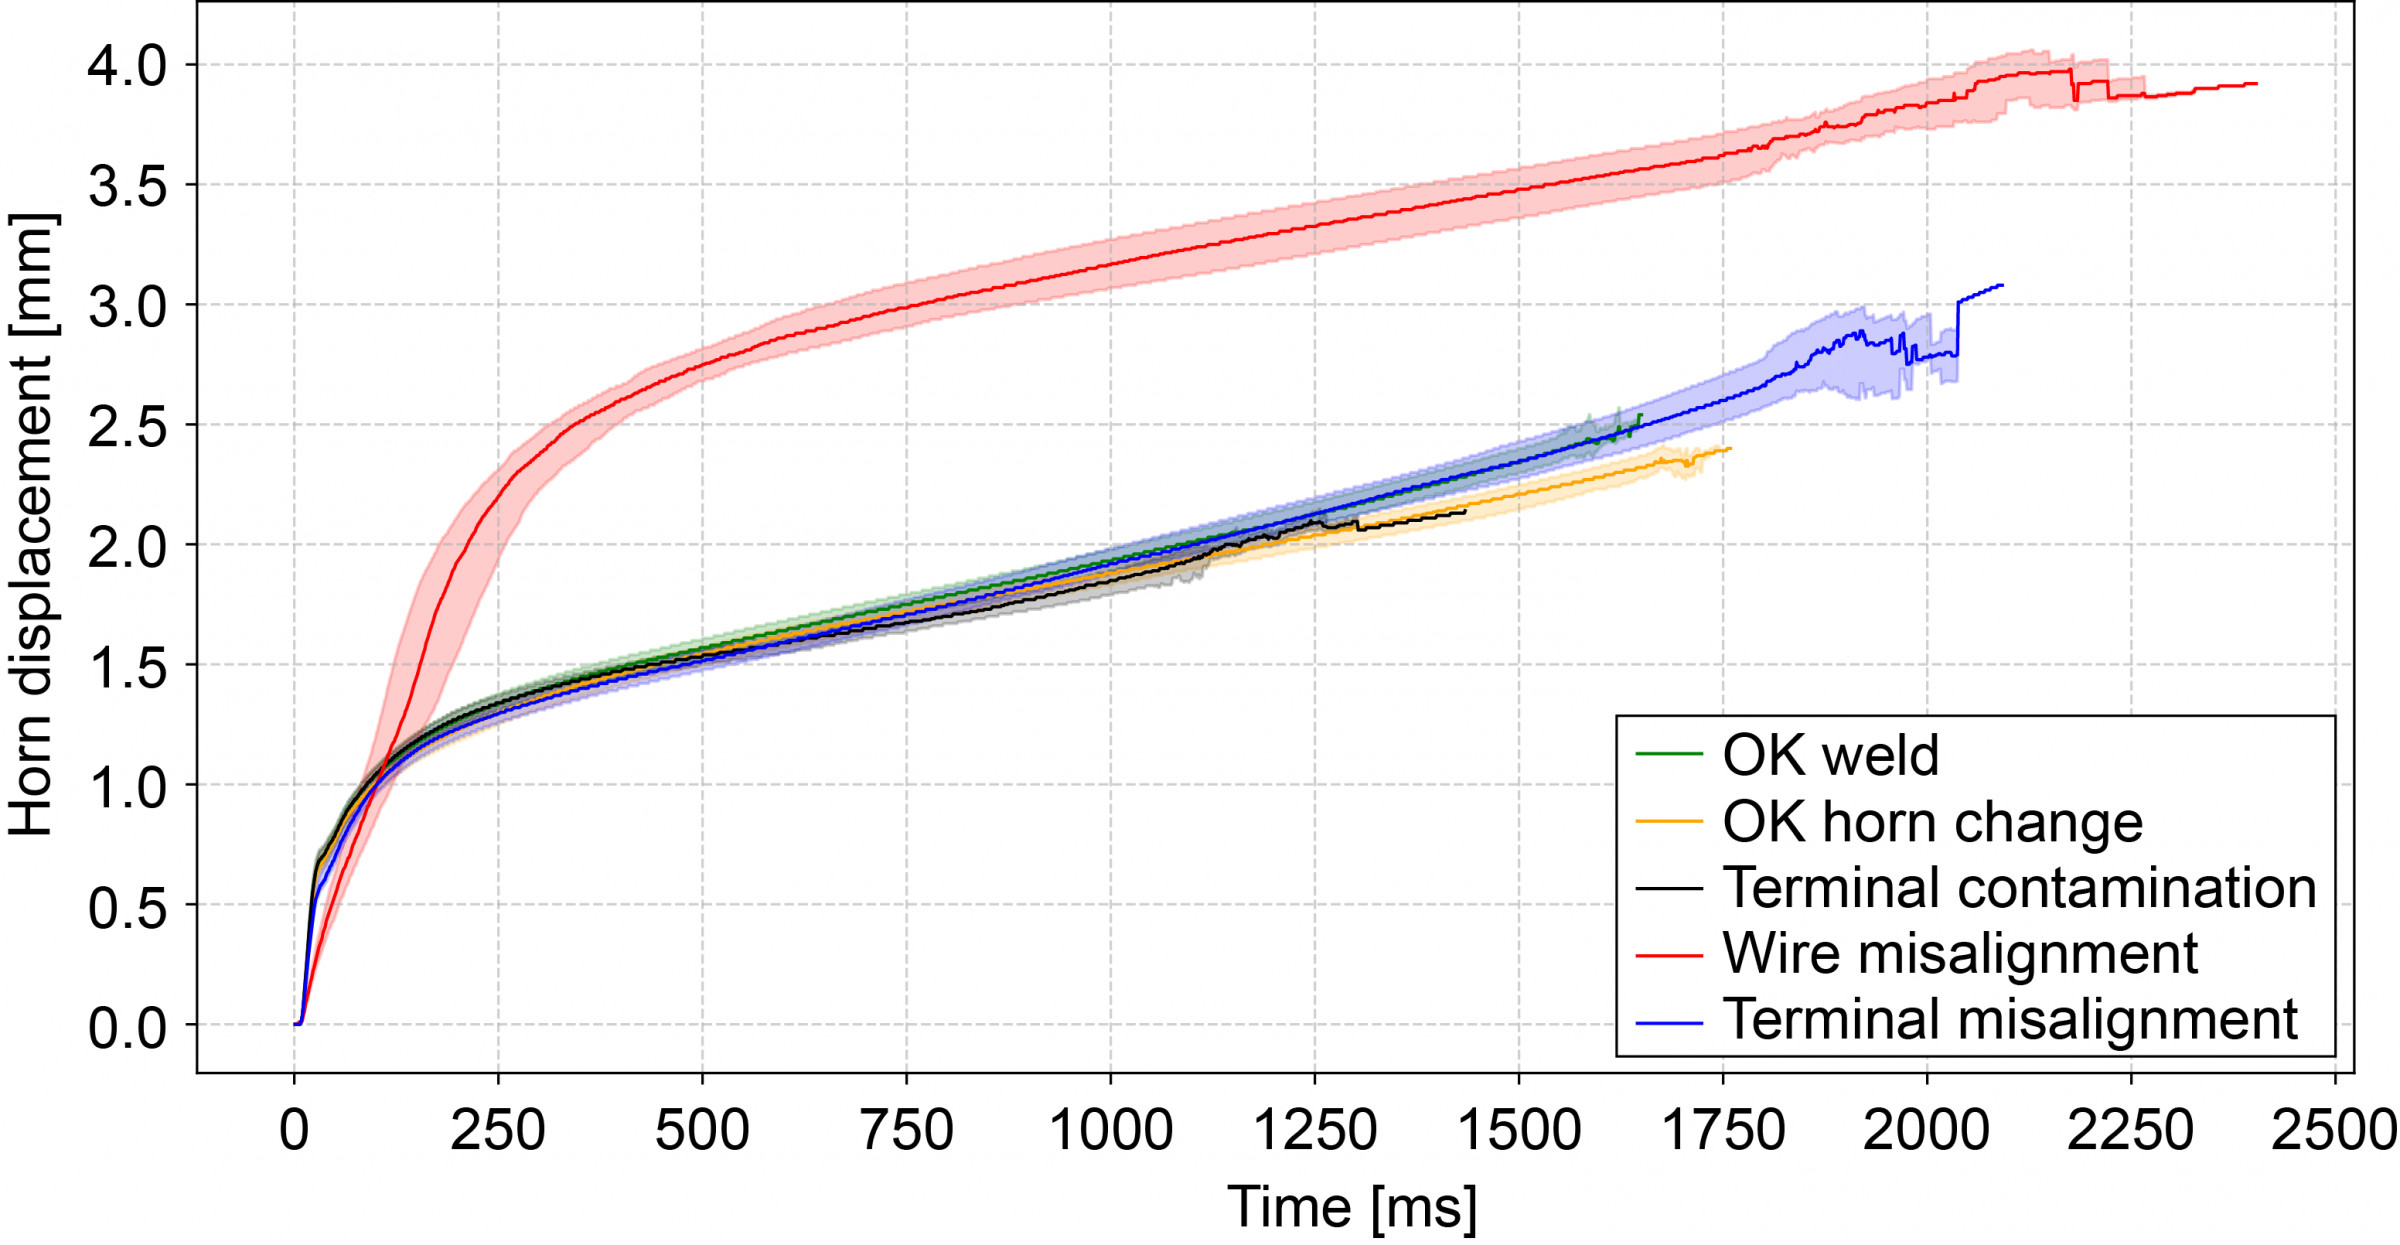
While the OK weld class is characterized by a continuously increase with low variance, the wire misalignment class in particular exhibits deviating patterns. This error class shows a steeper but delayed rise. These deviations point to a mechanically induced disturbance in the process.
When comparing the above Fig. 4 - 6 with plots of the achieved pull-out force against generator power, welding force, and horn displacement, it becomes clear that class affiliation is likewise reflected, as illustrated in Fig. 7.

While the insights from the data understanding phase generally point to good learnability of both class membership and pull-out force by a machine learning model, the underlying dataset suffers from a major issue: the “curse of dimensionality”. The number of features (i.e., measurement points per welding curve) is very high, whereas only a small number of training samples (600 in total) are available. The feature space is thus enormous, yet the available data points are relatively sparsely distributed. This makes it difficult for machine learning models to reliably discern patterns, since there is insufficient data to cover the high-dimensional space adequately. As a result, there is a significant risk of overfitting: models with many features and few training examples tend to fit the noise in the training set, “memorizing” its idiosyncrasies, instead of learning the true underlying relationships, leading to poor generalization on new, unseen data. Moreover, the likelihood of spurious correlations rises: with so many features, random correlations often appear in the training data that carry no causal meaning, yet a model may treat them as important. To mitigate these issues during data preparation, several strategies were employed. First, the number of data points was reduced by sampling individual data points from each welding curve at fixed intervals. Next, statistical features were extracted from generator power, horn displacement, welding force, and welding time, and also principal component analysis (PCA) was incorporated into the workflow. PCA is a dimensionality-reduction technique that transforms the data into a smaller number of principal components. Each of these components represents a linear combination of the original features and explains as much of the variance in the original data as possible. The statistical feature extraction employed multiple approaches, incorporating absolute measures (minimum, maximum, median, standard deviation) alongside metrics that capture curve variability and trajectory characteristics. One such metric is the “bend” feature, which identifies the inflection point in the rising phase of the curves. This point marks the transition from a steep increase to a phase of slower growth or saturation. For example, the feature d_b75 is defined as the first timestamp at which the power reaches at least 75 % of the maximum distance (d_max). To select different combinations of features throughout the development process, methods such as correlation matrices, ANOVA F-tests, model-based techniques like recursive feature elimination (RFE) with a support vector regressor, and feature-importance ranking using a random forest regressor were employed. To further ensure the prevention of overfitting, the experimental runs were conducted using five-fold cross-validation. In addition to the search for optimal model hyperparameters, each required training run was performed five times with random splits of the training data into training and validation sets. The best model from these runs was then evaluated again on the held-out test data to validate the results, particularly with regard to their transferability to unseen data. The results obtained on the test data were subsequently used to assess the model’s performance. In the area of neural networks, the use of the dropout technique served to reduce the risk of overfitting by the models. During training, randomly selected neurons and their connections are temporarily deactivated, forcing the network to learn without them. This creates an ensemble-like effect, as each training run with a different set of active neurons acts as a small, individual model. During testing, all neurons are active again, but the weights are scaled accordingly. As a result, the model becomes overall more robust and better able to generalize to new, unseen data.
For the metallographic analysis and microstructural characterization of the joining zone, specimens were sectioned and prepared for electron backscatter diffraction (EBSD) and nanoindentation. These cross-sections were prepared without embedding media, as embedding was found to adversely affect surface quality, EBSD pattern acquisition and overall specimen integrity. While infiltration with non-conductive resins is generally feasible, it requires subsequent carbon coating to ensure sample conductivity for EBSD, which can introduce additional artefacts and preparation steps. In contrast, electrically conductive embedding compounds, such as metallized epoxy resins, proved too viscous to adequately infiltrate the narrow interstitial spaces between the individual aluminum strands, resulting in incomplete filling, leakage of uncured resin and poor mechanical stabilization. In addition, the use of hard embedding media led to abrasive redeposition and surface scratching during polishing, especially at the interface between resin-rich areas and soft aluminum. Detached particles were frequently smeared across the measurement surface, compromising both EBSD pattern quality and nanoindentation accuracy. Given that the specimens consisted of inherently conductive aluminum and copper, embedding was omitted altogether. This approach, combined with careful mechanical handling, yielded significantly more stable signals and reproducible surface conditions for both microstructural and mechanical analyses. Given the mechanical softness of the aluminum strands and the limitations of conventional embedding techniques, the specimens were instead mounted on a dedicated preparation holder using Crystalbond 509 adhesive from PLANO GmbH. This mounting compound provides sufficient mechanical fixation for grinding and polishing, while enabling gentle specimen release at 85–110 °C, thus avoiding any thermal influence on the microstructure. The cross-sections were ground and polished using a graded sequence of diamond suspensions (9 µm to 0.25 µm), followed by final polishing with oxide-based OPS suspension to remove any embedded particles. After cleaning in an ultrasonic bath with acetone and isopropyl alcohol, the specimens were dismounted from the preparation holder and remounted on SEM stubs using conductive silver paint. EBSD measurements were conducted using a field emission scanning electron microscope NEON 40EsB from Zeiss equipped with an EBSD detector from EDAX, and the data were processed using OIM Analysis software.
Nanoindentation tests were performed using an UNAT system from ASMEC to quantify local hardness variations within the stranded aluminum conductors near the weld interface. Heatmaps were generated with Origin Pro from Origin Labs to visualize hardness gradients as a function of welding time and distance from the interface. These data were correlated with EBSD results to assess recrystallization behavior and microstructural softening effects in the aluminum strands.
To assess the electrical behavior of the ultrasonic welded joints under realistic operating conditions, ampacity tests were conducted using a high-current test rig. The measurements were carried out at the Robert Bosch GmbH, Renningen, Germany, where a dedicated test bench permitted current loads of up to 1.3 kA. The setup consisted of a constant current source, data acquisition (DAQ) units for voltage and temperature, and an isolated fixture for reproducible clamping of the specimens, shown in Fig. 8.
 ampacity test stand, (b) detailed view of the test rig - © Technische Universität Chemnitz")
To ensure consistent current introduction, both ends of the aluminum wire were ultrasonically welded to identical terminals. Central threaded holes were drilled into each terminal to enable bolted attachment to the copper contact blocks of the test fixture. Current was applied through these blocks, while voltage was measured directly at the weld interface. Type-K thermocouples were used to measure the temperature at three positions: both weld interfaces and the center of the wire between the terminals. The thermocouples were inserted between the wire strands and the insulation through defined openings. The temperature and voltage data were logged over the duration of each current load cycle. Three welding conditions were evaluated to reflect different joint qualities, shown in table 4. For producing these weld states, the USMW system was switched from energy control mode to time control mode. Each sample was tested at current levels of 200 A, 500 A, and 800 A for a fixed duration of 380 s. It should be noted that the aluminum conductors used in this study with cross sections of 50 mm² are nominally rated for 200 A. The higher current levels of 500 A and 800 A were intentionally selected to investigate thermal robustness and fault tolerance under overload conditions.

3. Results and Discussion
3.1. Classification and pull-out force prediction
Since the problem at hand is a supervised learning problem, each input dataset is associated with known target values, both a welding class label and a pull-out force value. The goal of the modelling was to develop a suitable machine learning model that learns a function capable of making reliable predictions on new inputs, both for the classification into the different welding classes and for pull-out force. Because a single machine learning model cannot predict discrete and continuous targets concurrently, separate models were tested for classification and regression. Table 5 provides an overview of the methods evaluated for each problem class:

The number of approaches tested for predicting pull-out force is substantially higher (16) than the number tested for the classification of the welding classes (6). This is because very good results were obtained much more quickly for the classification problem than for the regression once, making it necessary to expand the experimental trials to improve the predictive performance for pull-out force.
the regression task. The methodological framework extended beyond feature selection and core machine learning approaches for hyperparameter optimization, data scaling, and augmentation techniques. To ensure robust results, the dataset was partitioned into training and test sets, and cross-validation was employed throughout the experiments. The procedure for a single experiment essentially followed the process outlined in Fig. 9.

Evaluation results were fed back into subsequent development cycles, forming an iterative development process. The model evaluation was carried out using appropriately chosen metrics. For classification, the model results were compared based on the accuracy metric; for the models predicting pull-out force, the mean absolute error (MAE) was used as the evaluation criterion. As a starting point for assessing the regression models, a simple baseline model was defined. This model serves as a point of comparison and is based on the assumption that pull-out force can be estimated solely by the median value of its class. Accordingly, for each experiment the pull-out force was predicted using the class median alone, without considering any other features. The aim of this approach is to establish a lower performance bound that more advanced machine learning models should ideally surpass. In the context of result evaluation, it must be noted that the pull-out force tests intrinsically carry an error rate of 5 % to 10 % due to measurement inaccuracies, and consequently a machine learning model cannot achieve an MAE below this error range.
The following section discusses the experimental results in detail. Reducing the number of features by extracting a fixed number of data points from the welding curves (subsample size) yields significantly poorer performance for both classification and regression compared to using statistical features, as displayed in Table 6.

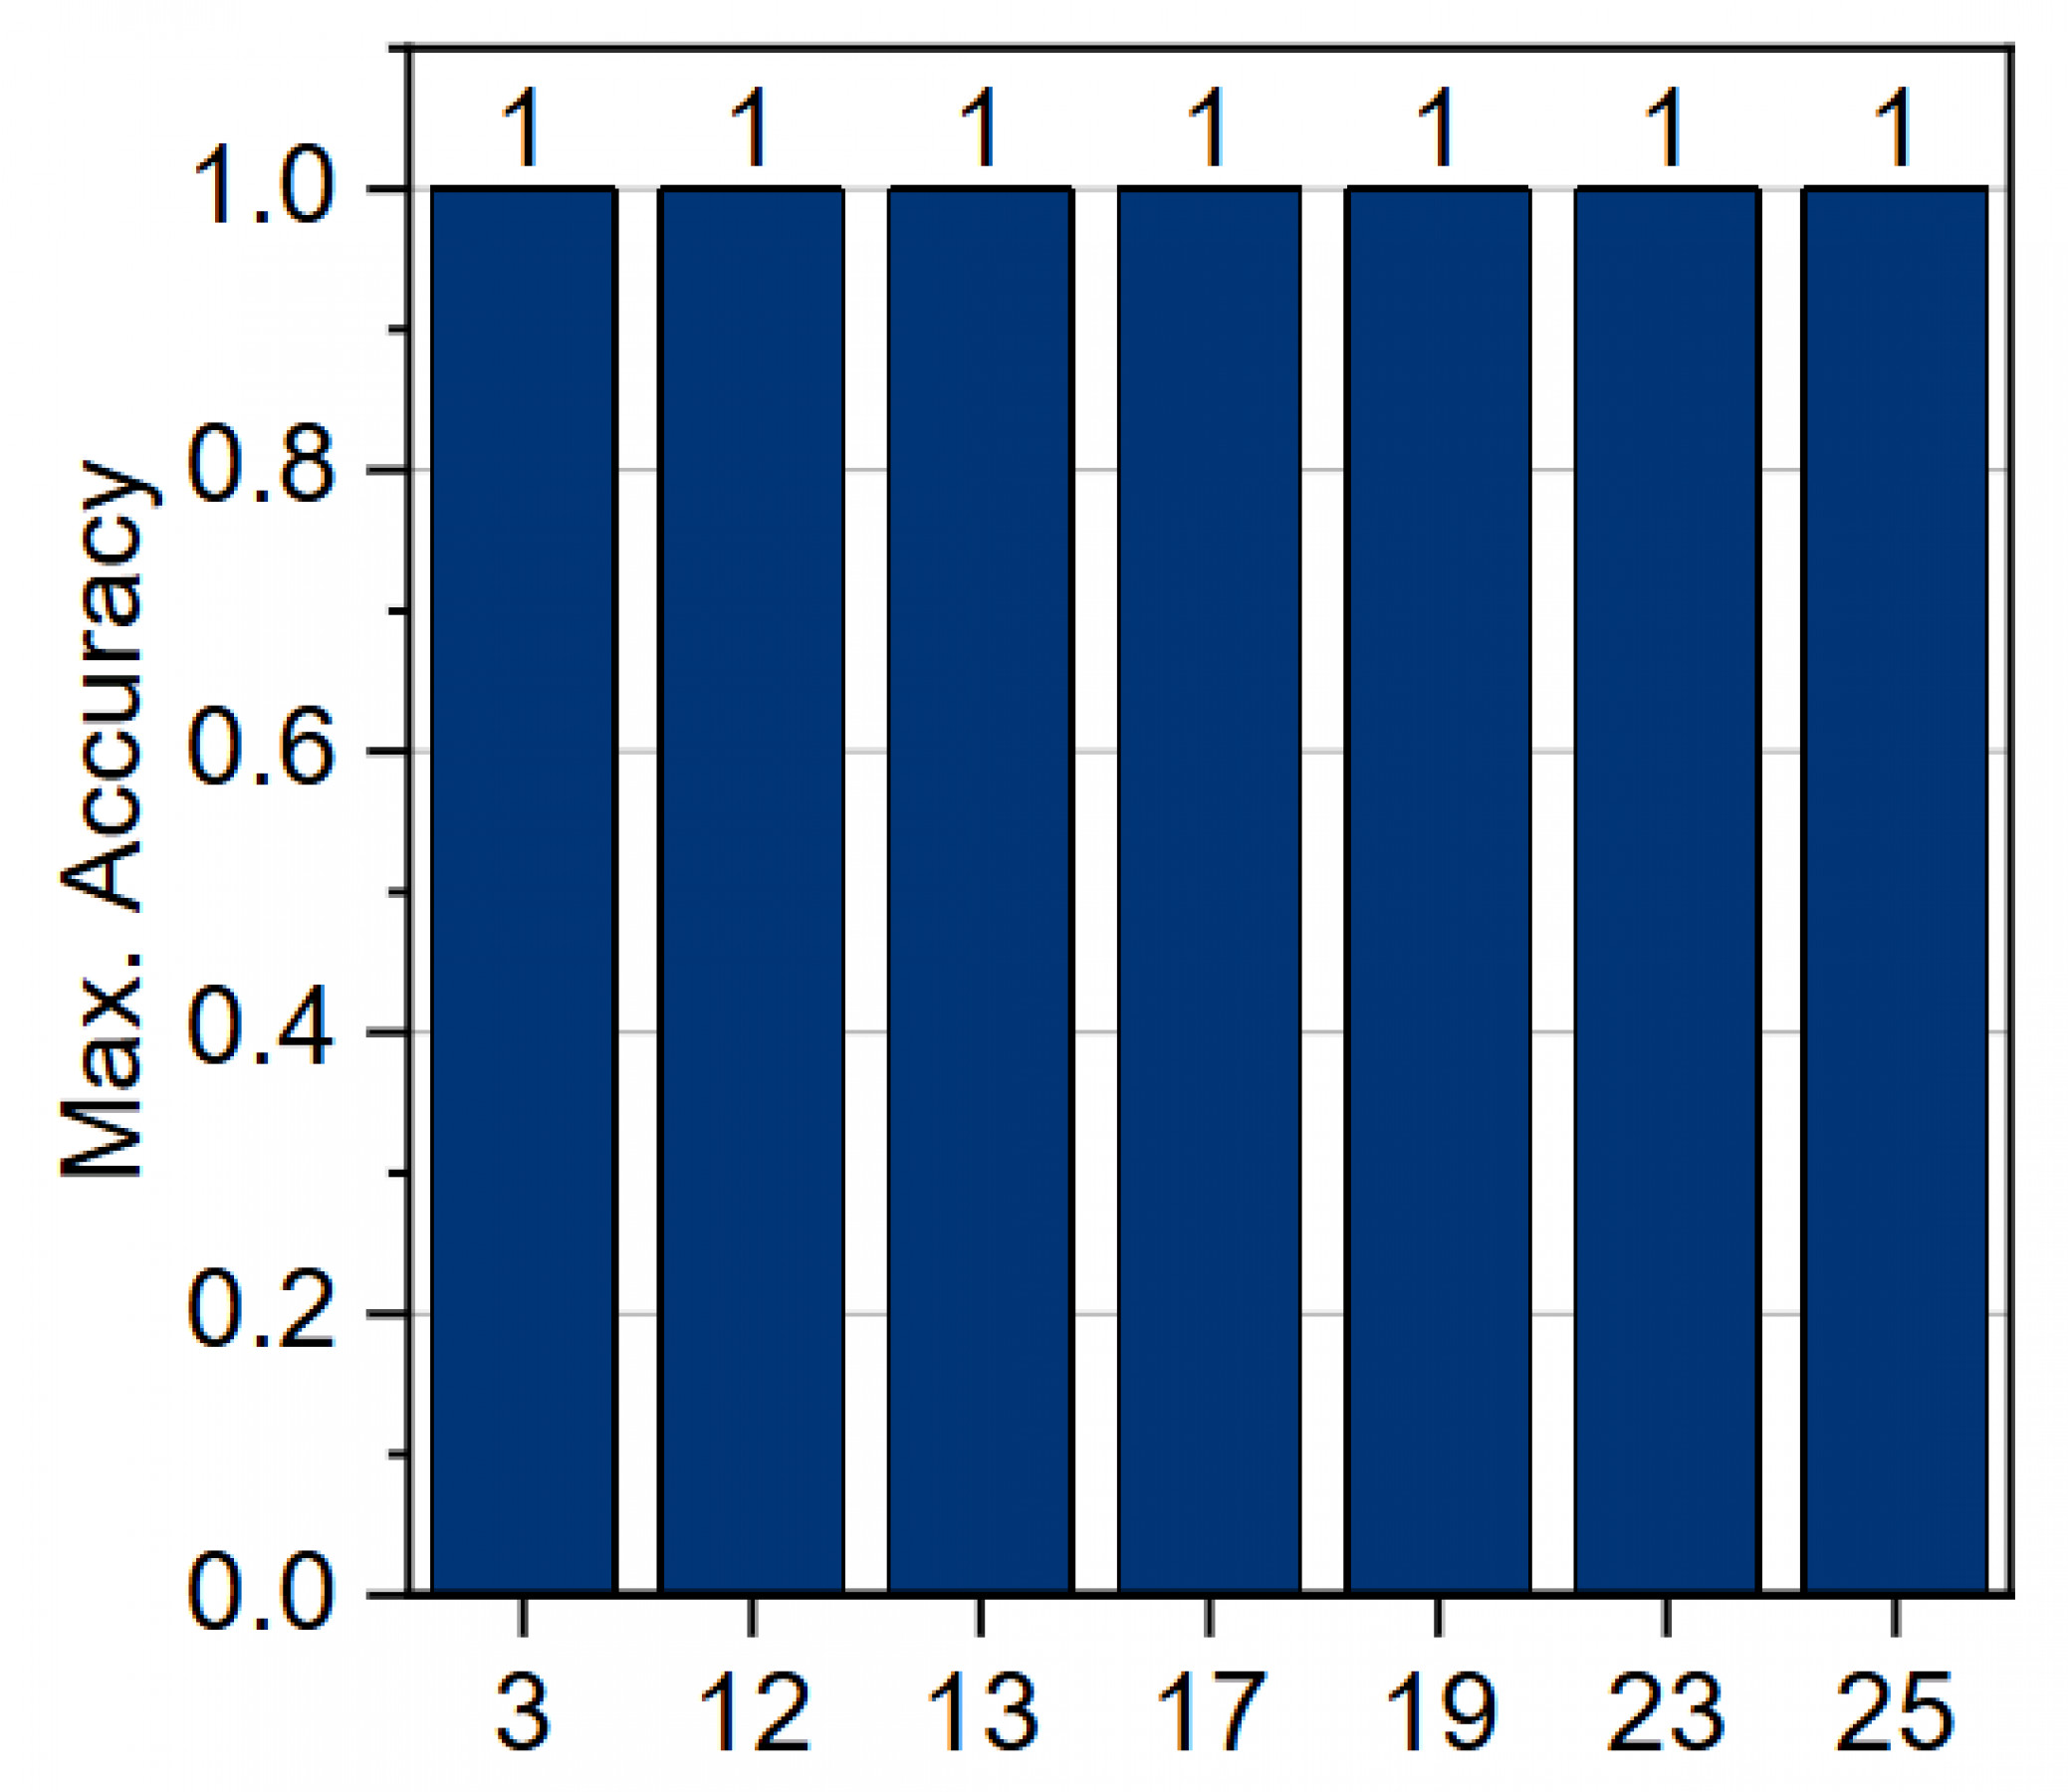
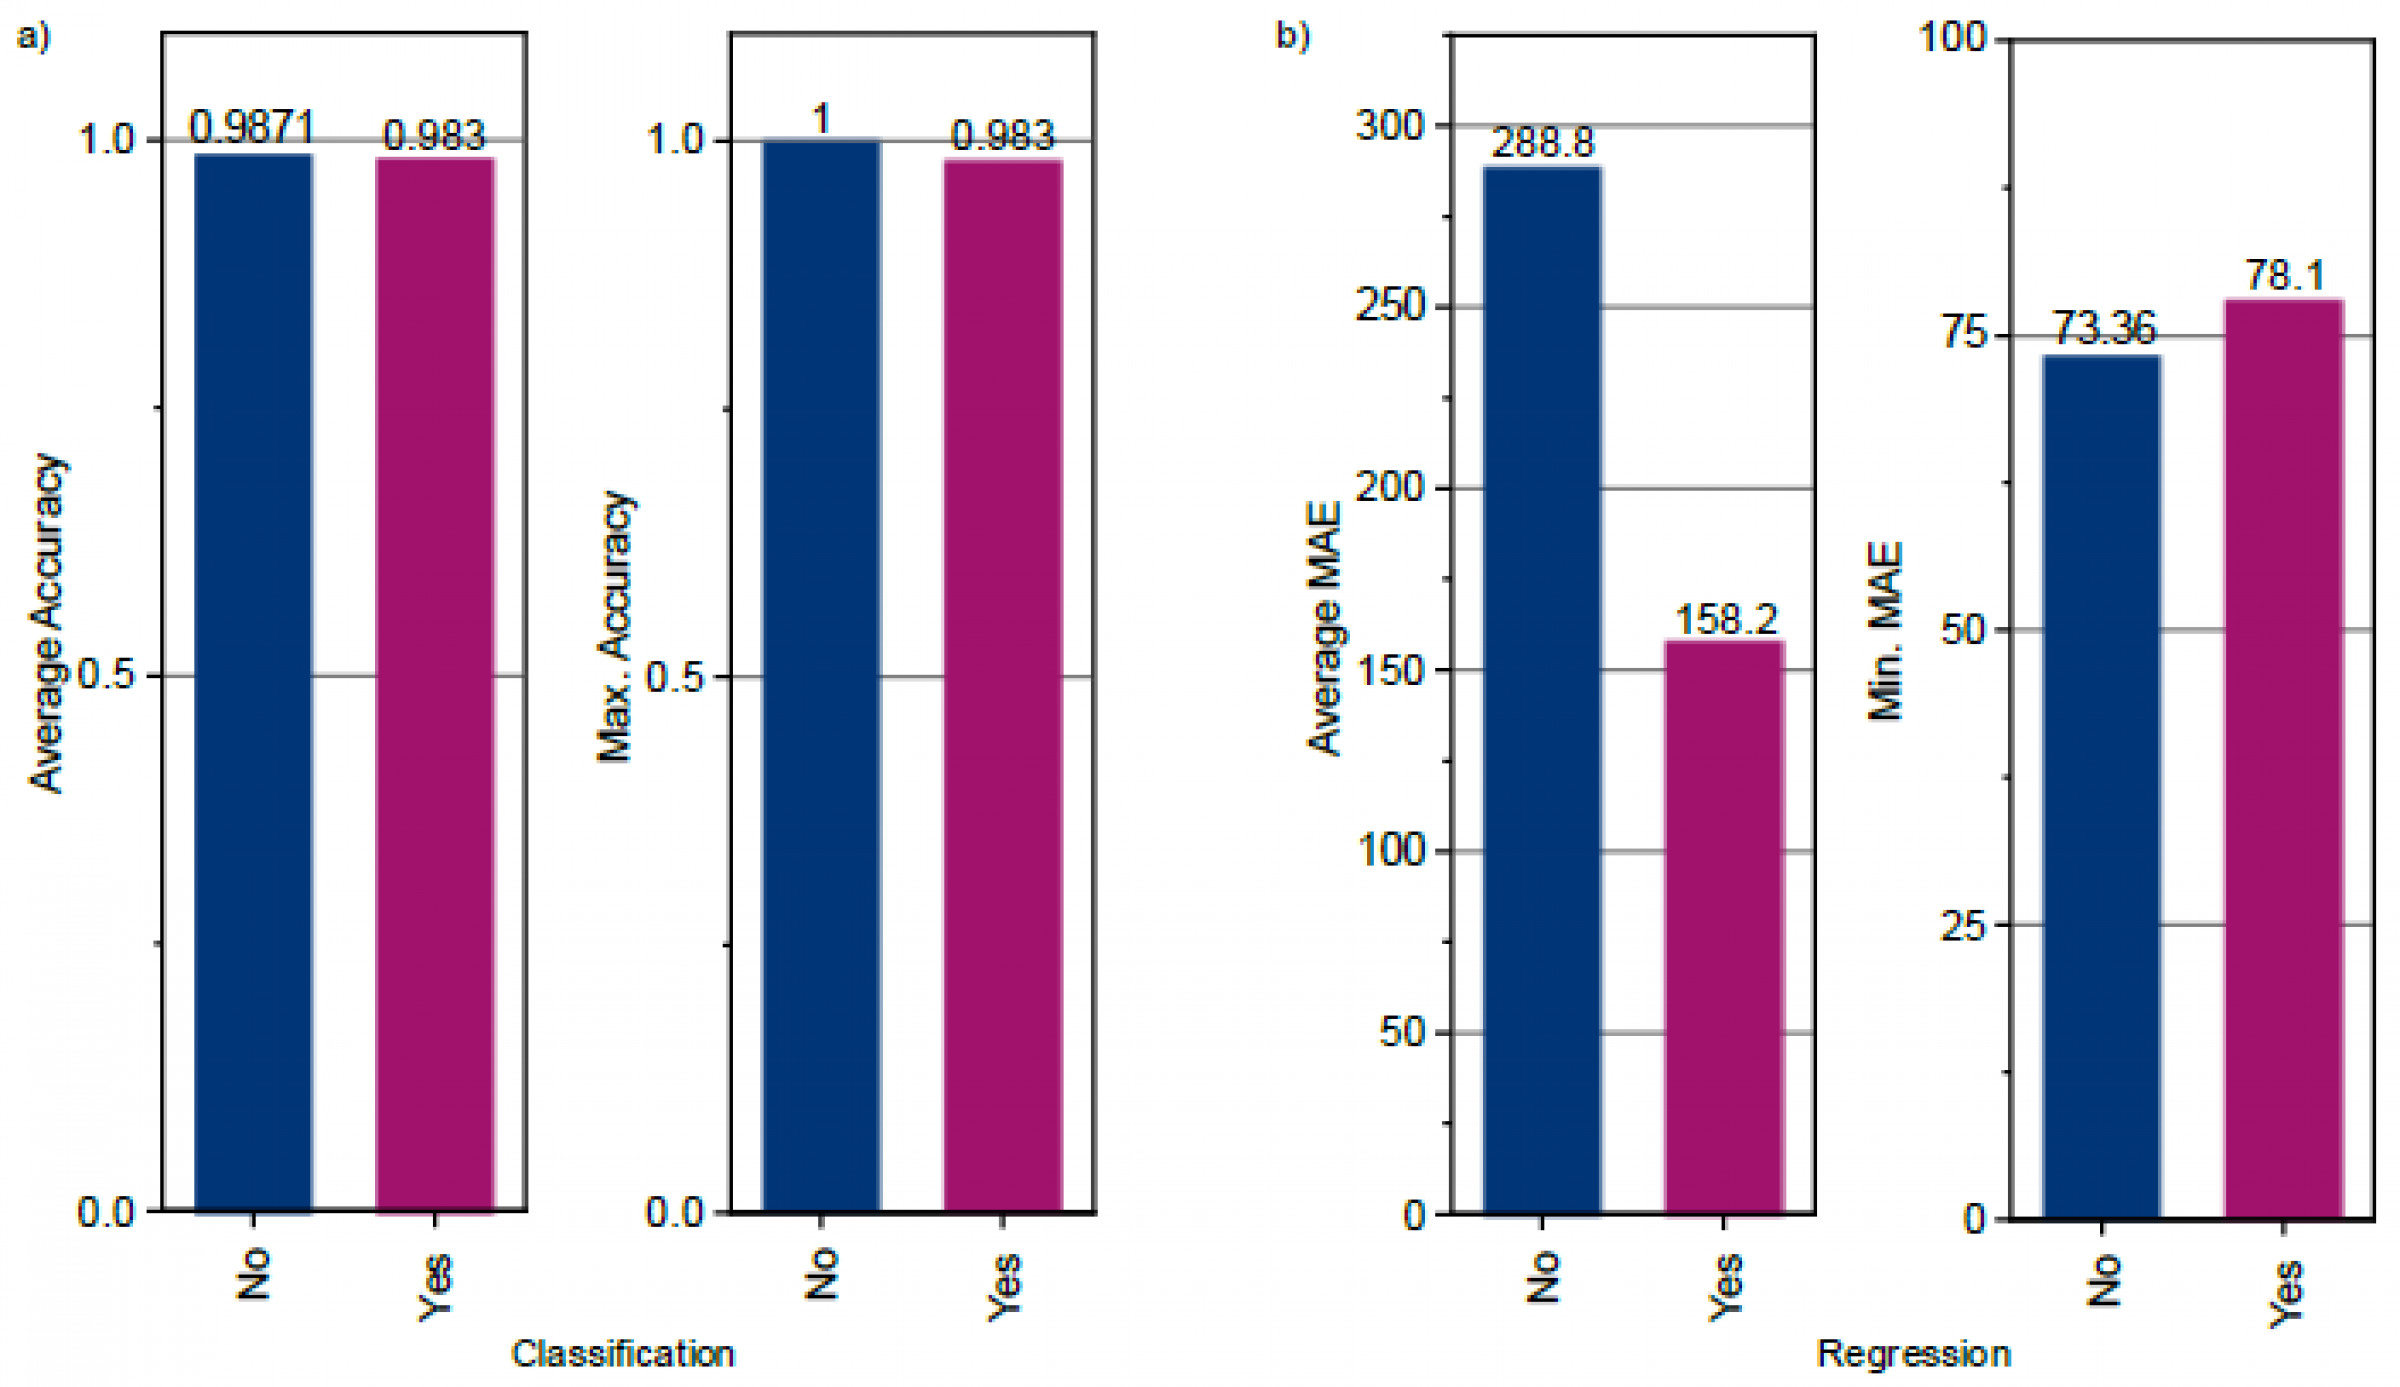
While the total number of statistical features was less critical overall, they consistently delivered excellent performance in both tasks. As indicated in Fig. 10 classification accuracy reached 100% in all cases using statistical features.
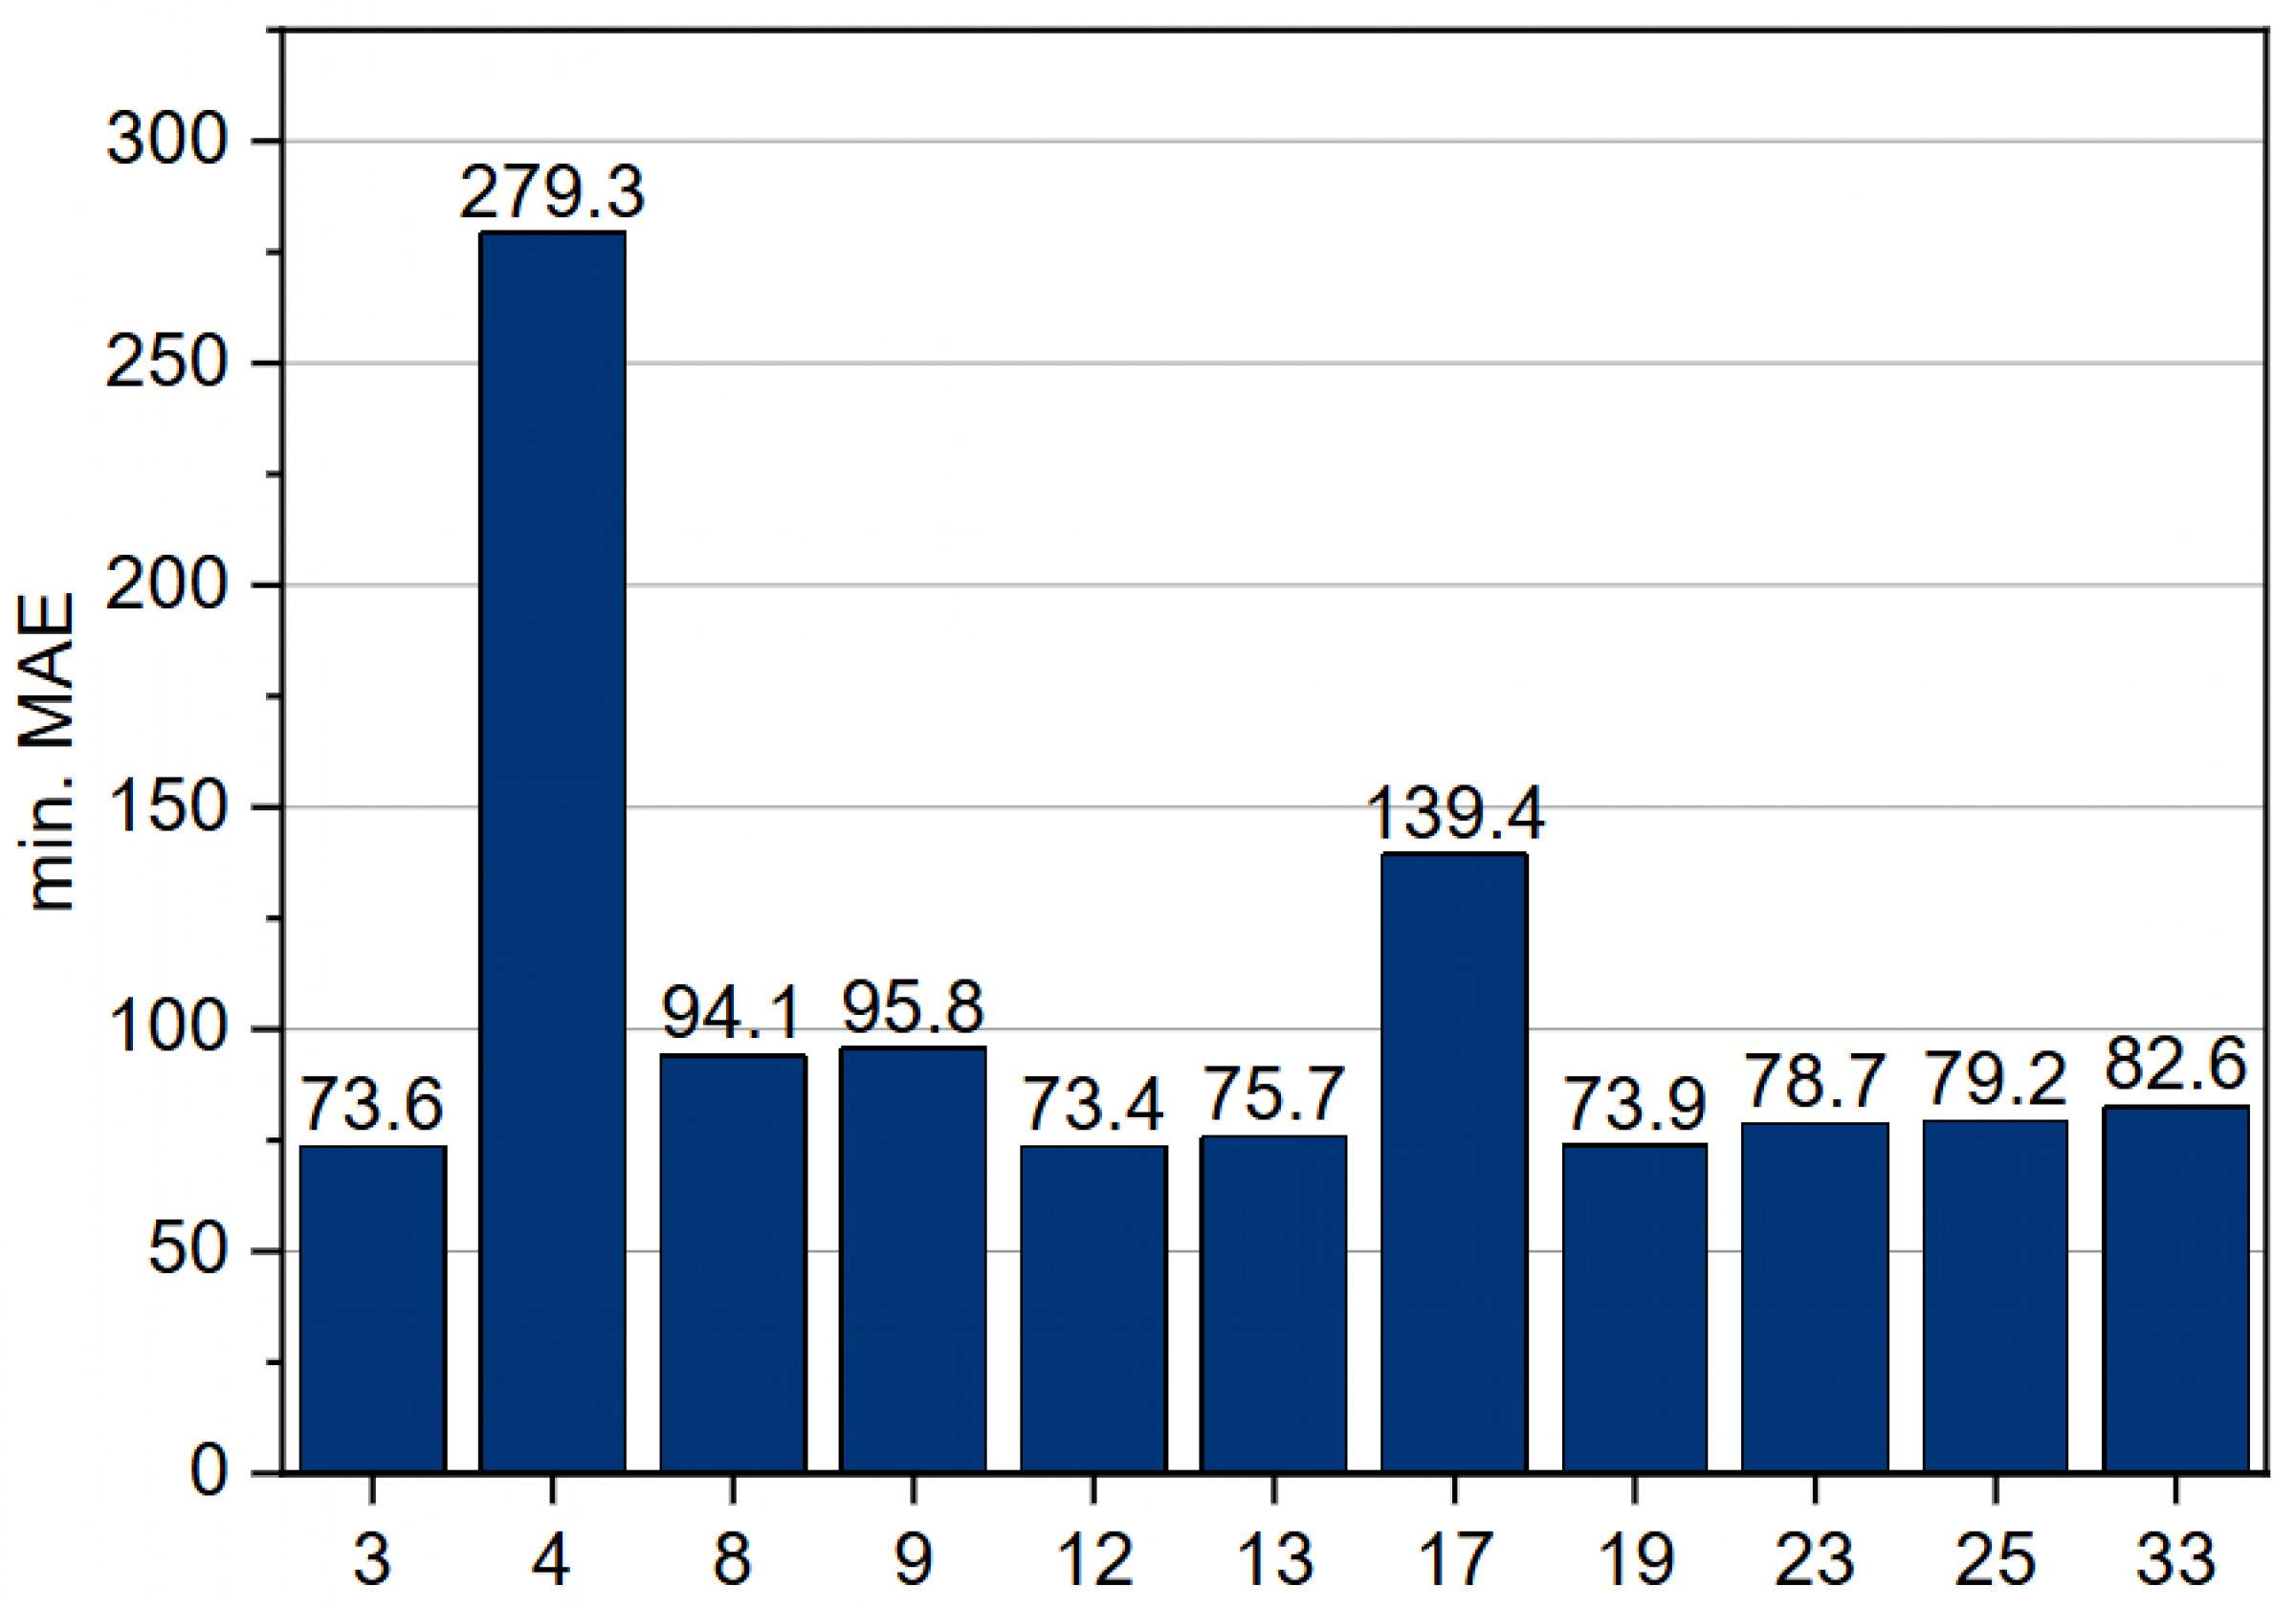
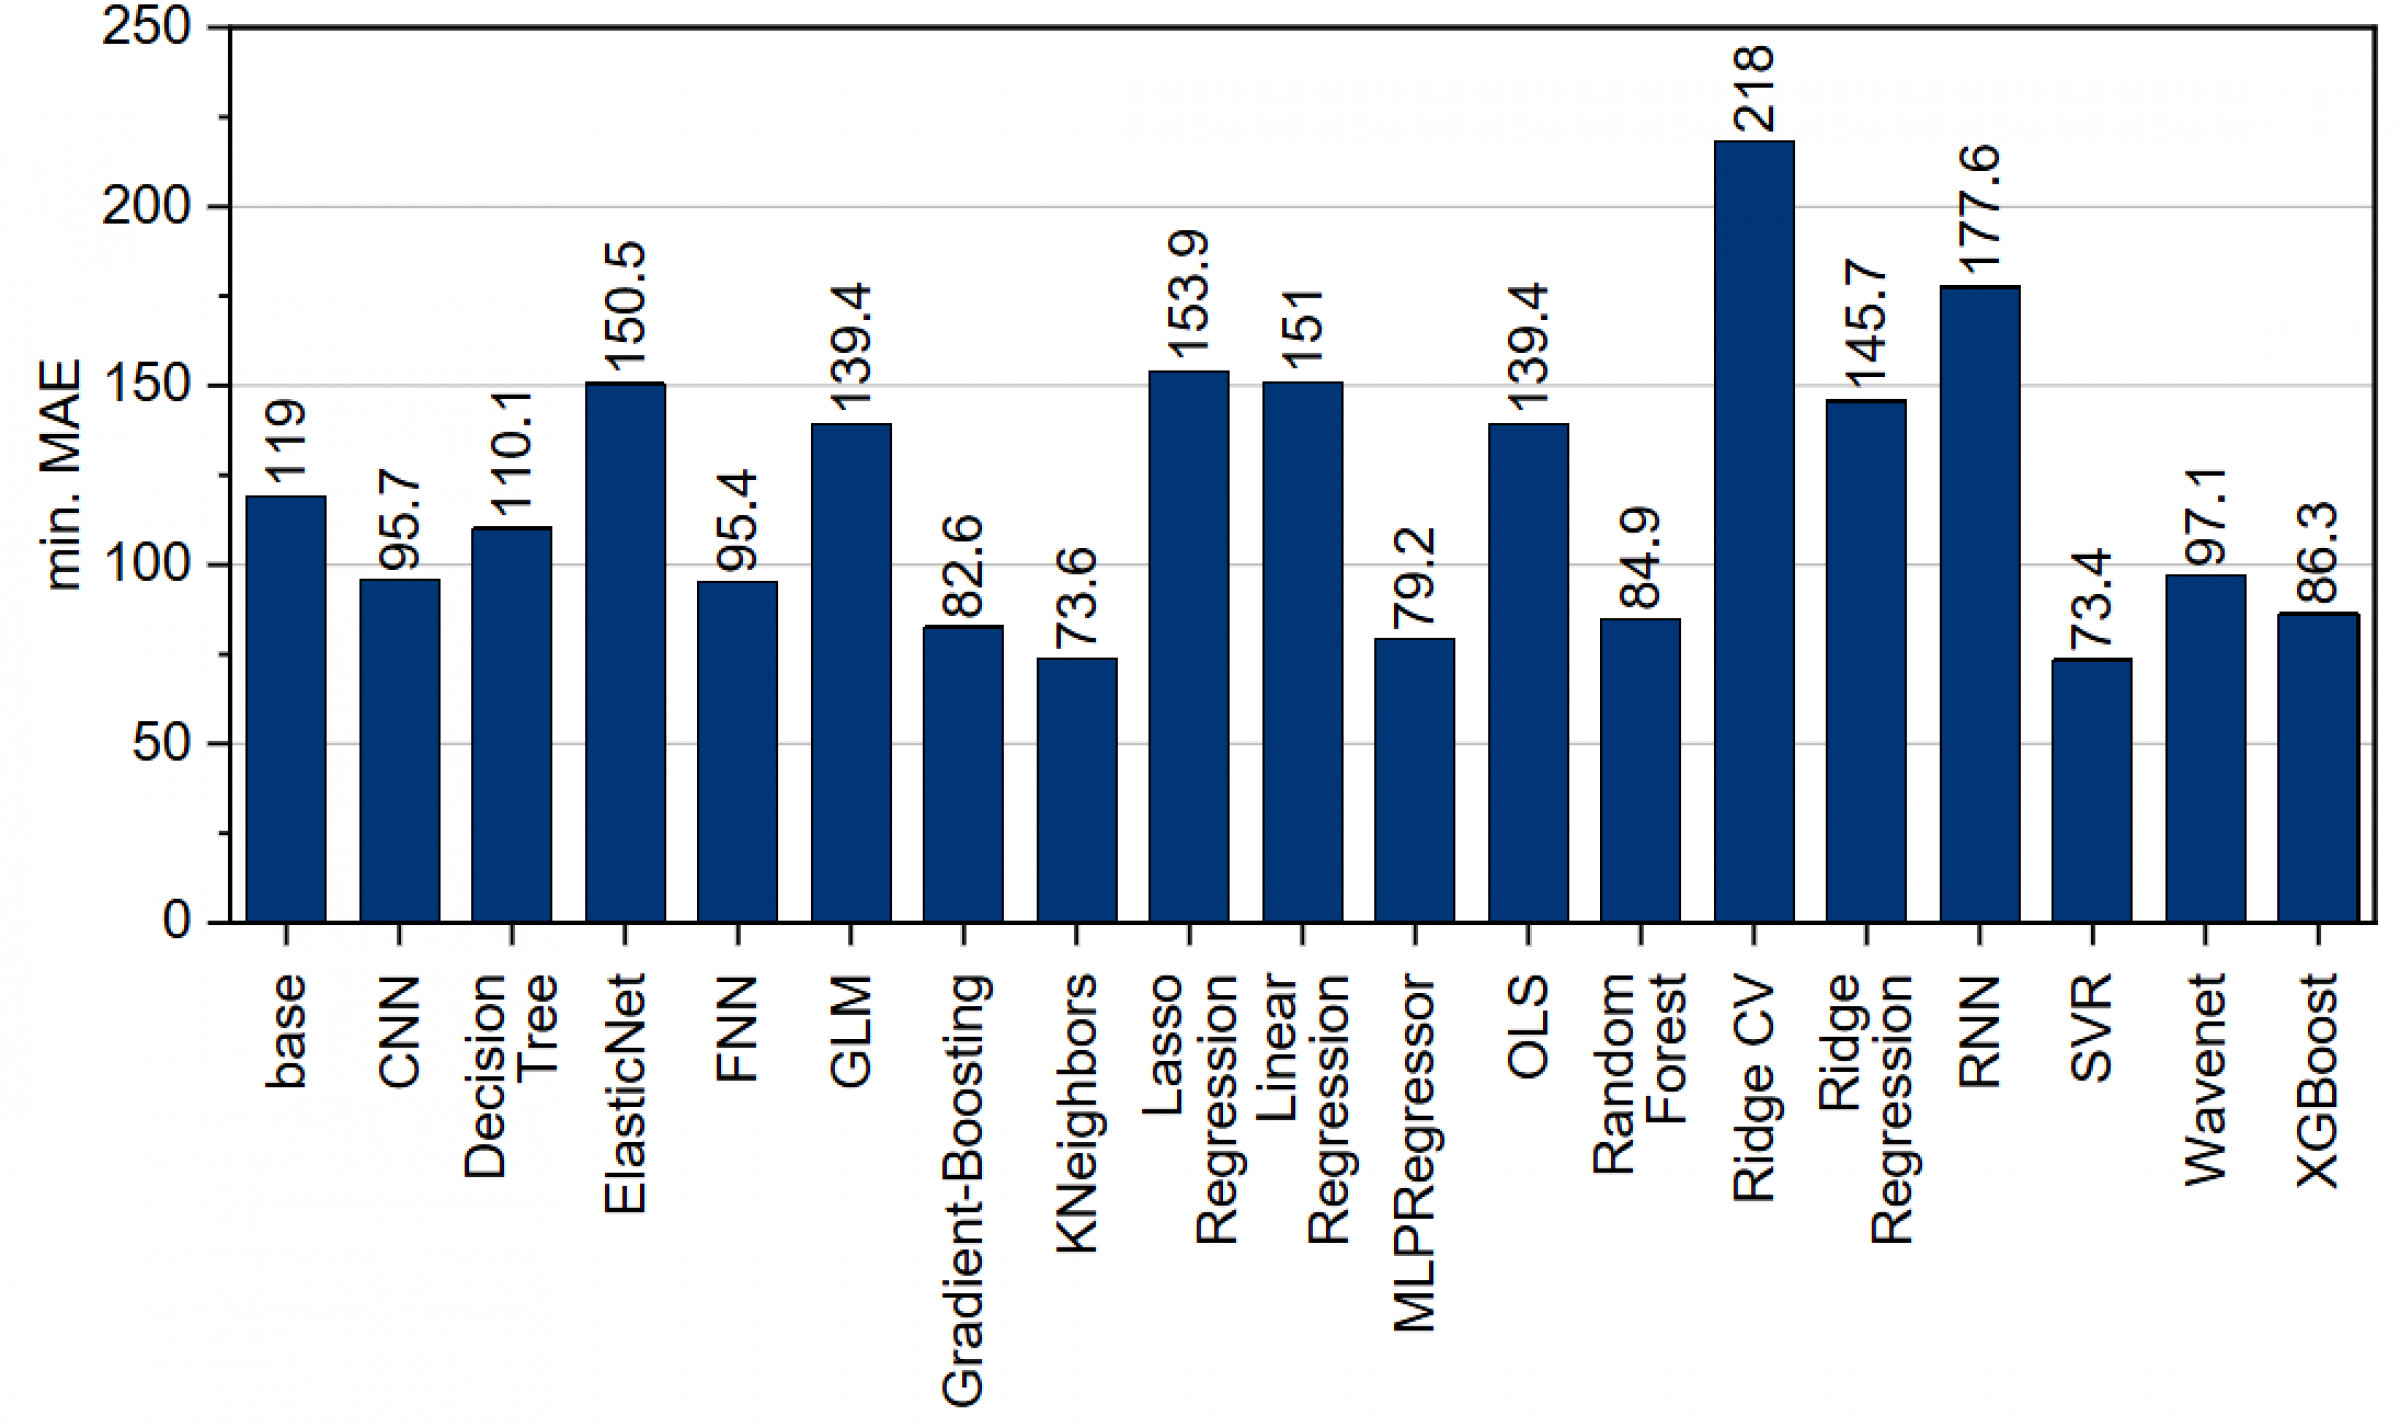
The results in using statistical features for predicting pull-out force exhibit somewhat more variability, but overall they are quite similar: using three statistical features yielded a minimum MAE of 73.6, while using 33 statistical features yielded a minimum MAE of 82.6, shown in Fig. 11.
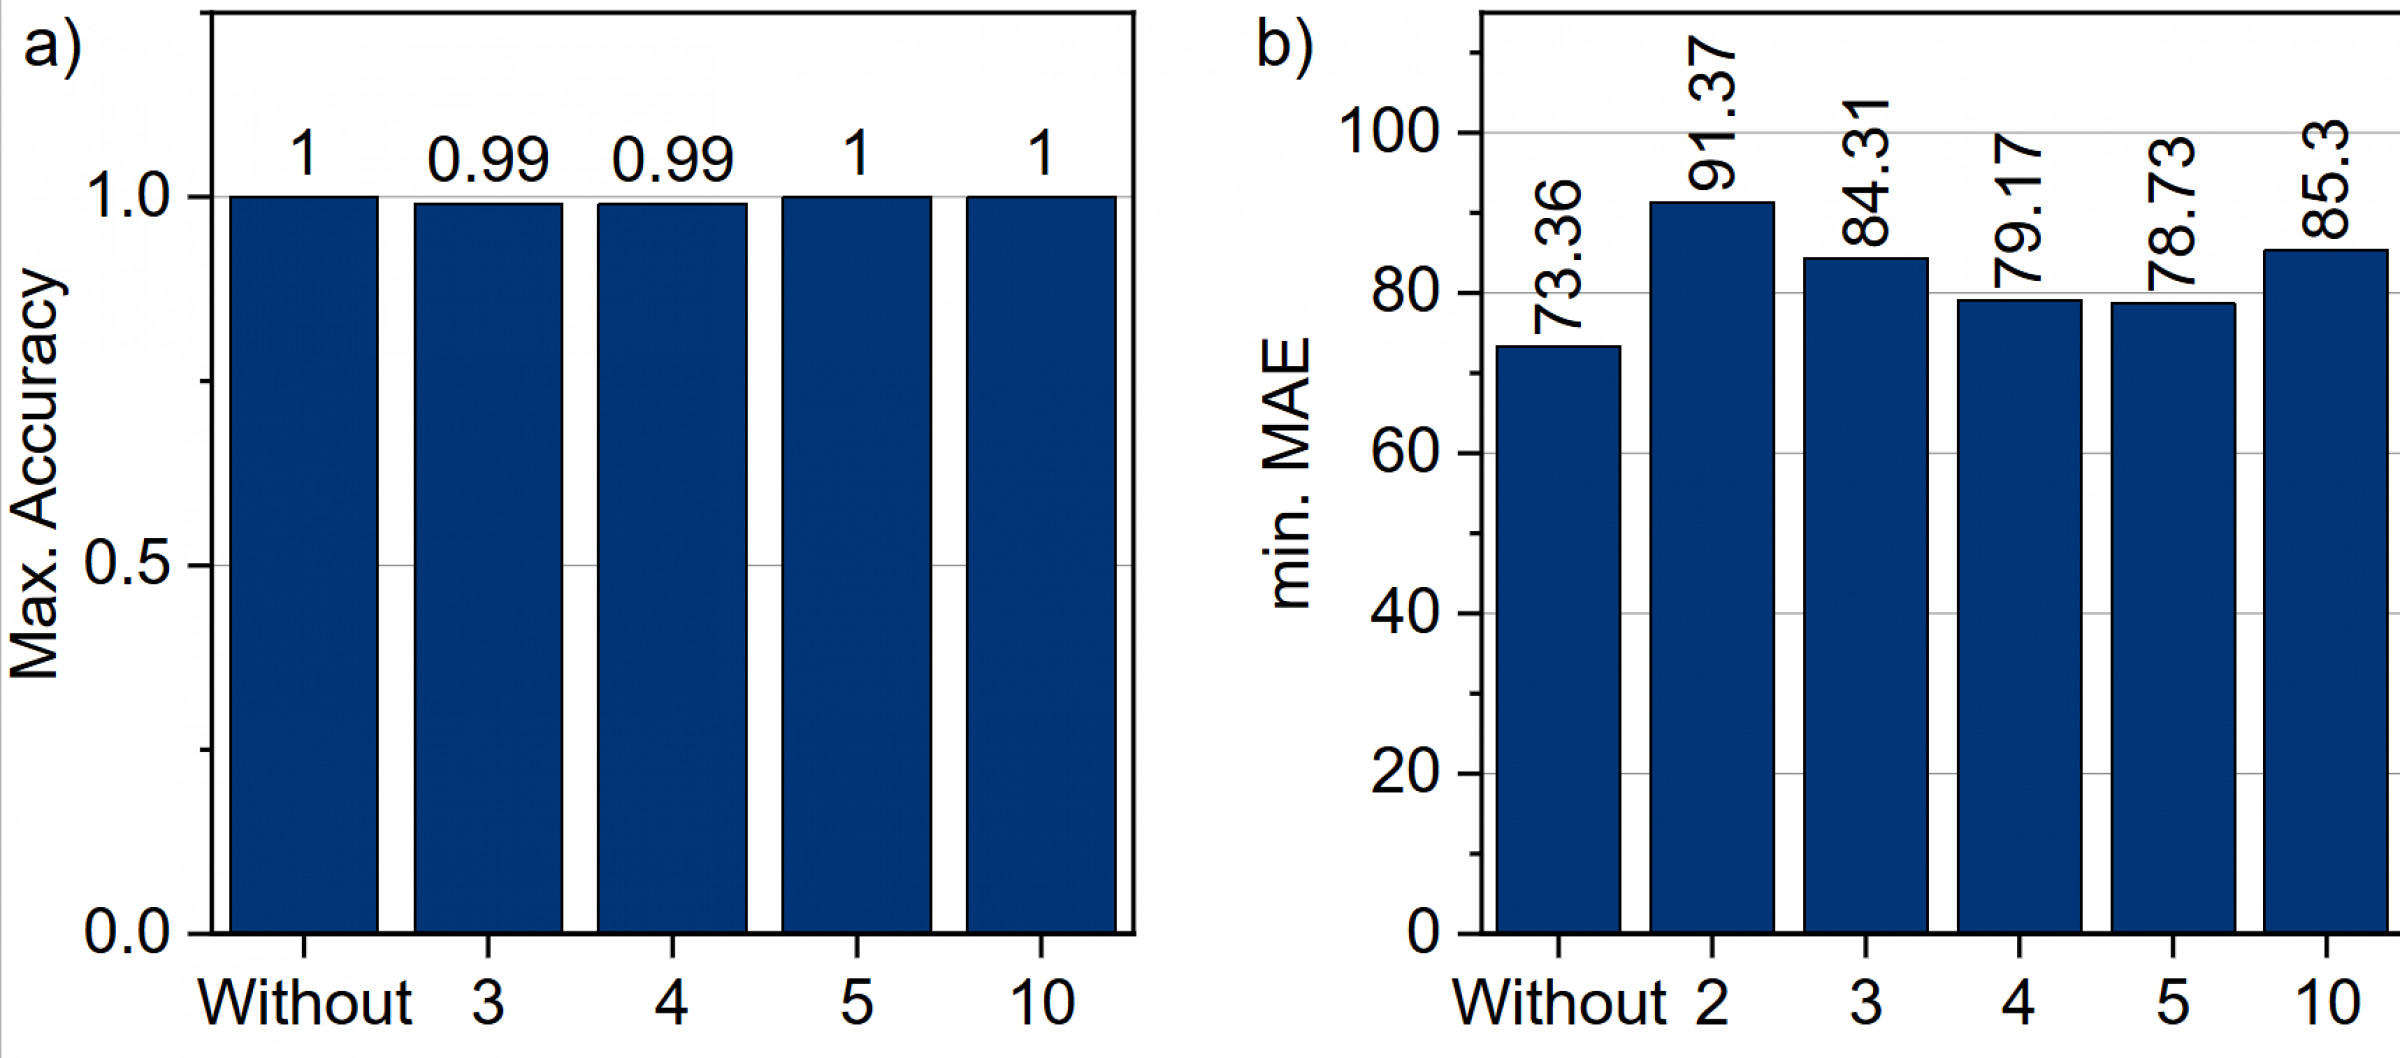
The performance deviations observed with four and 17 statistical features can be attributed to the predominant use of linear regression models in these runs, which underperformed relative to alternative methods. The use of PCA for feature extraction offers no clear advantage. In classification tasks, statistical features alone are sufficient to achieve excellent performance. For regression, the best result was likewise obtained without any PCA analysis, observable in Fig. 12.
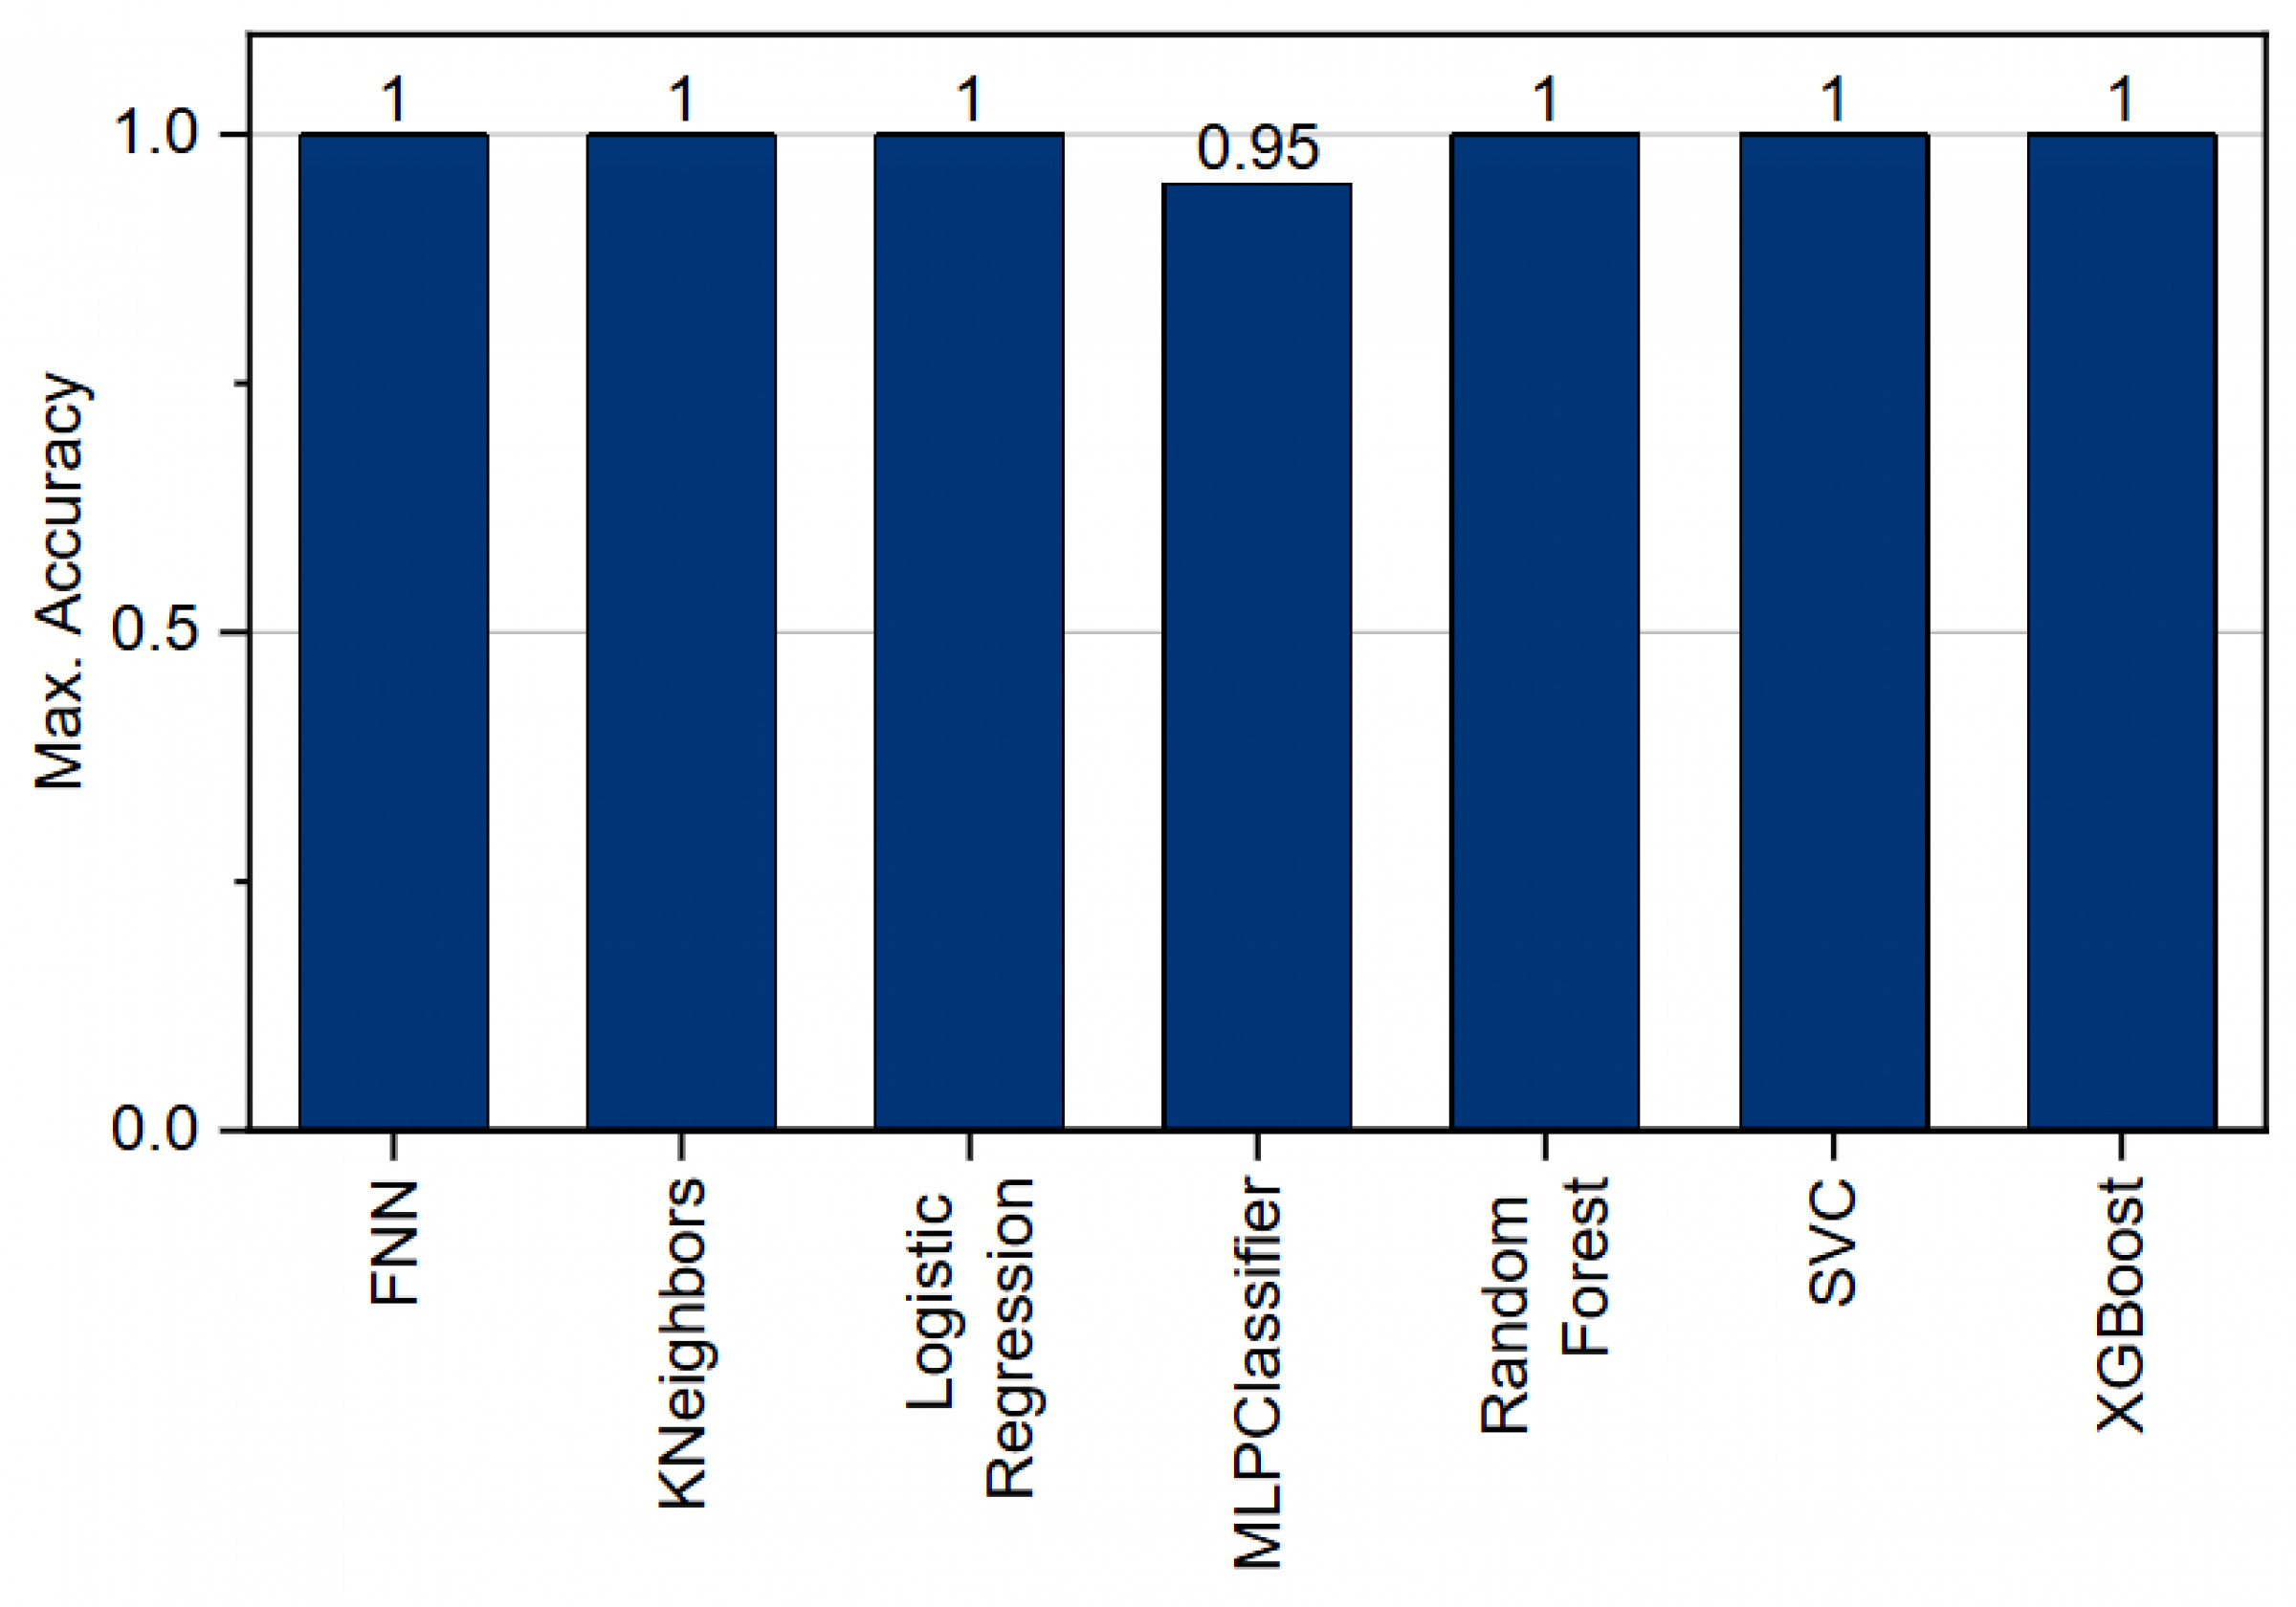
The use of cross-validation ensures that the results of both feature extraction strategies can be adequately evaluated with regard to the reduction of overfitting. With regard to the machine learning algorithms tested for the classification task, a direct comparison shows that, with the exception of the MPClassifier, all methods, after some tuning, were able to achieve 100 % accuracy (see Fig. 13).
For the algorithms used to predict pull-out force, there are significant differences in the results achieved, as shown in Fig. 14.
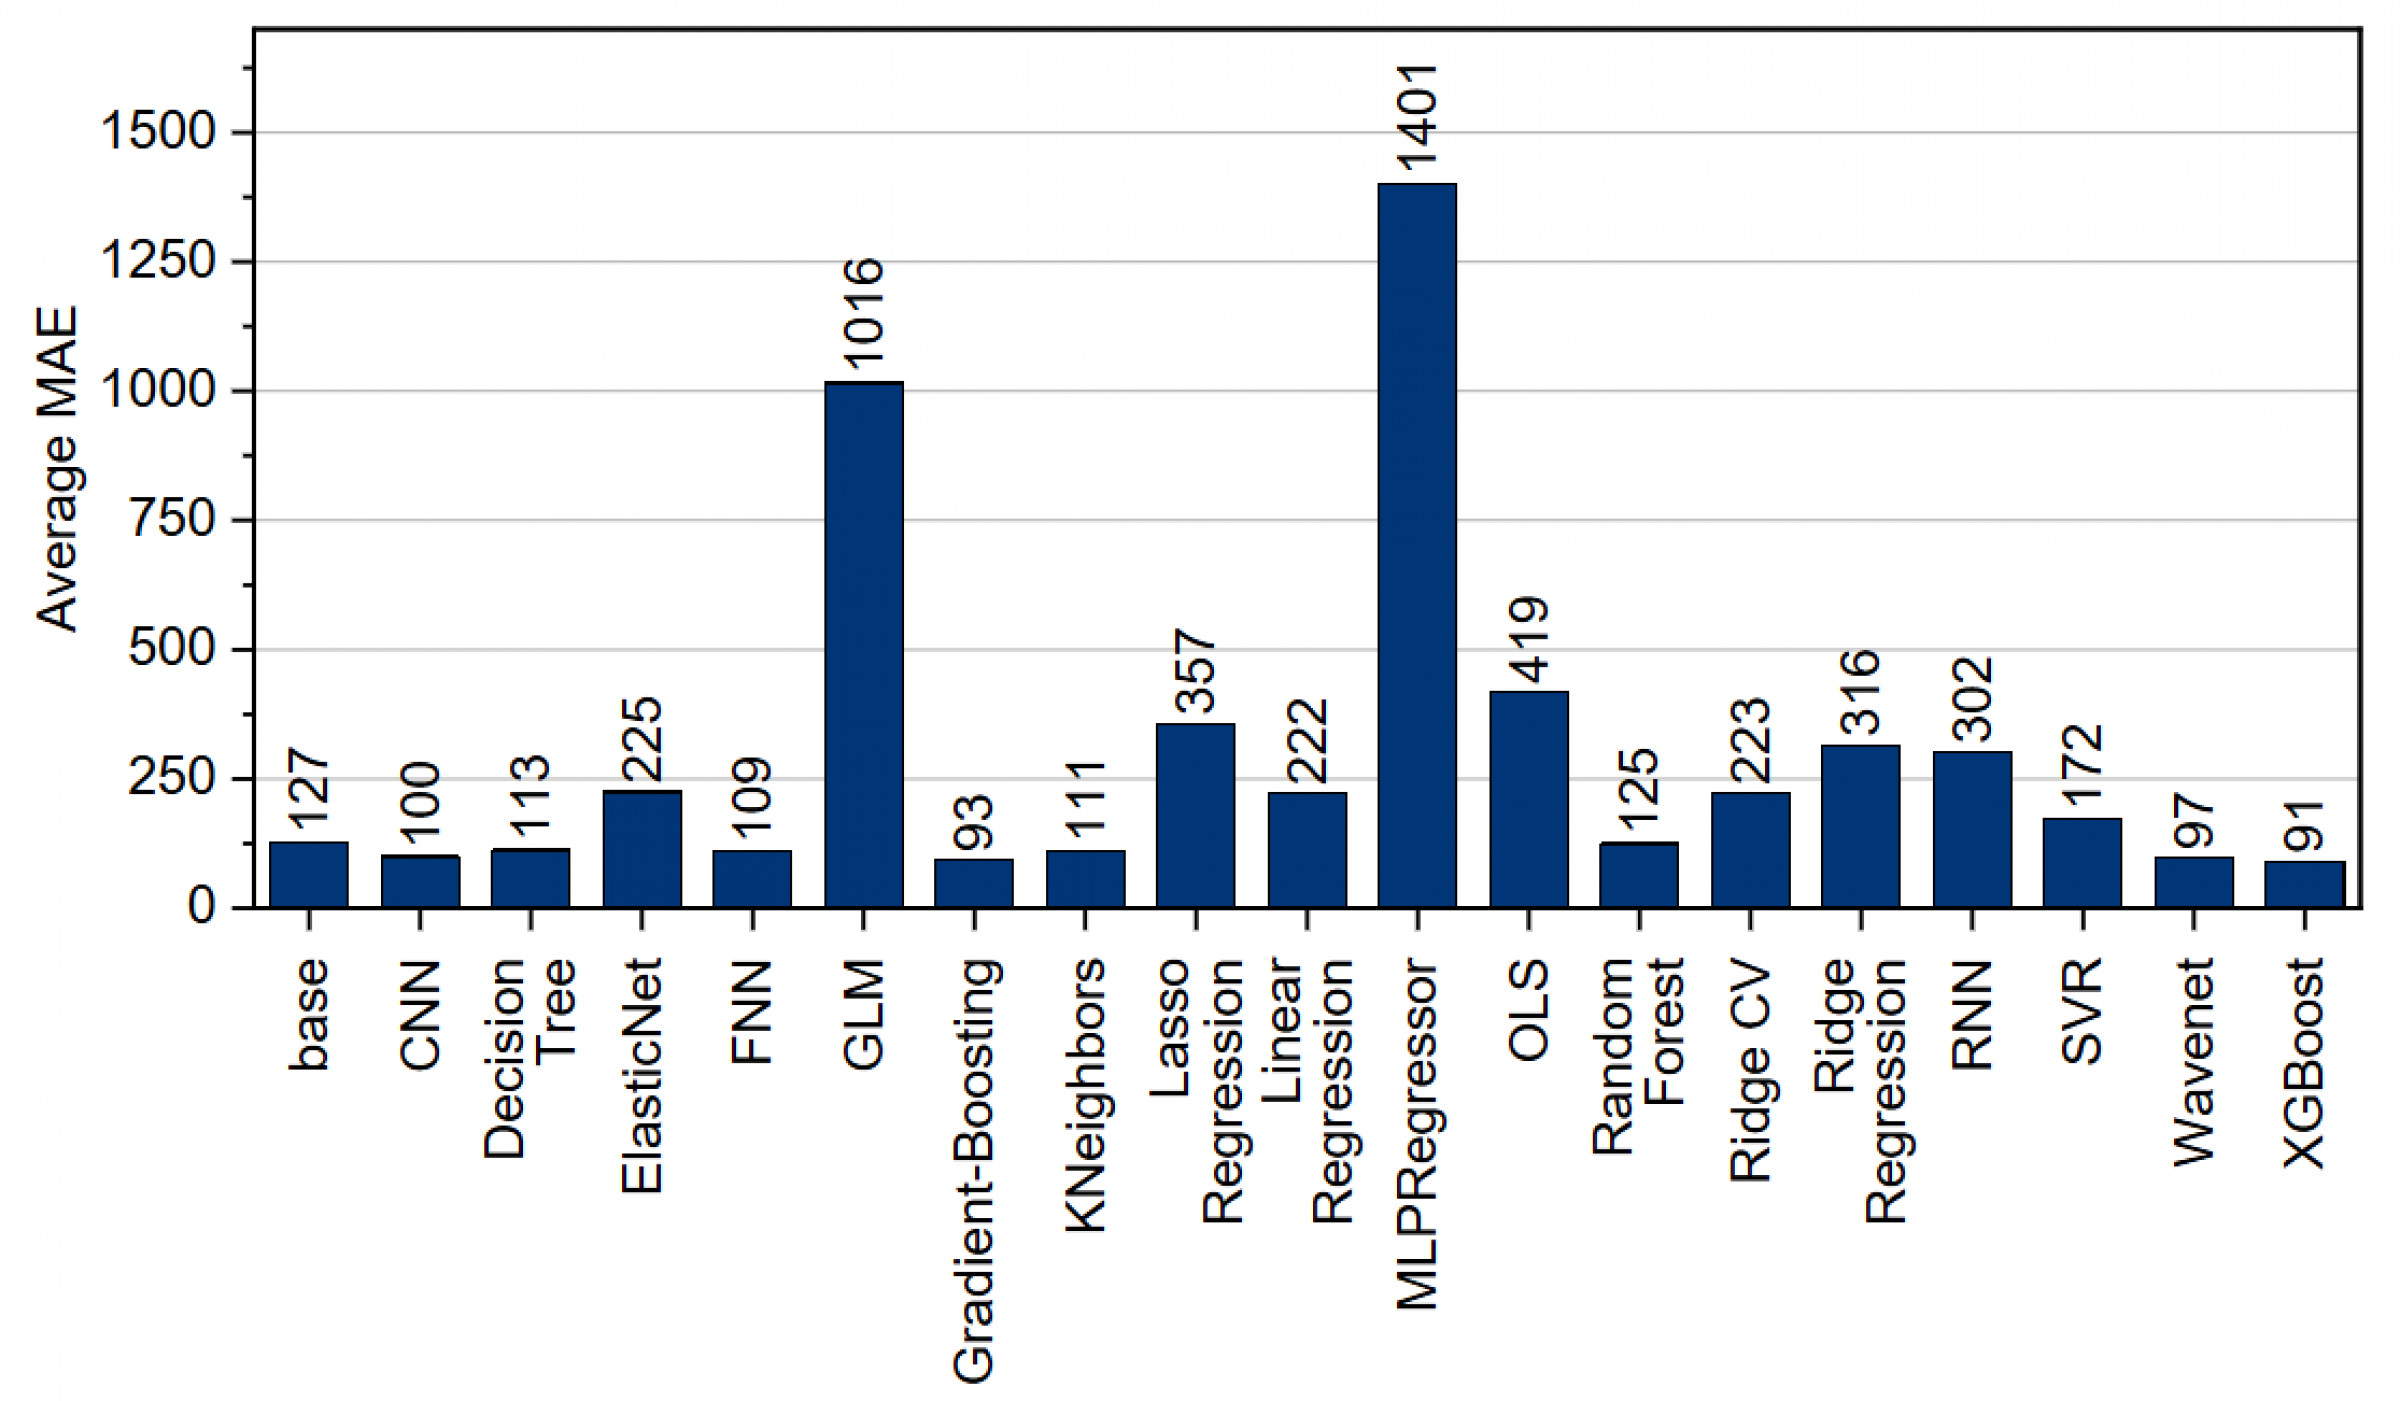
The best performance for predicting pull-out force was achieved by a support vector machine, with a minimum MAE of 73.4, closely followed by KNeighbors at 73.6 and an MLPRegressor at 79.2. The poorest results were obtained by RidgeCV, with a minimum MAE of 218.0, and the recurrent neural network, with a minimum MAE of 177.6. The MLPRegressor demonstrates excellent minimum MAE performance while exhibiting poor average results (see Fig 15). In contrast, RidgeCV shows weak minimum performance but consistent mid-range average predictions.
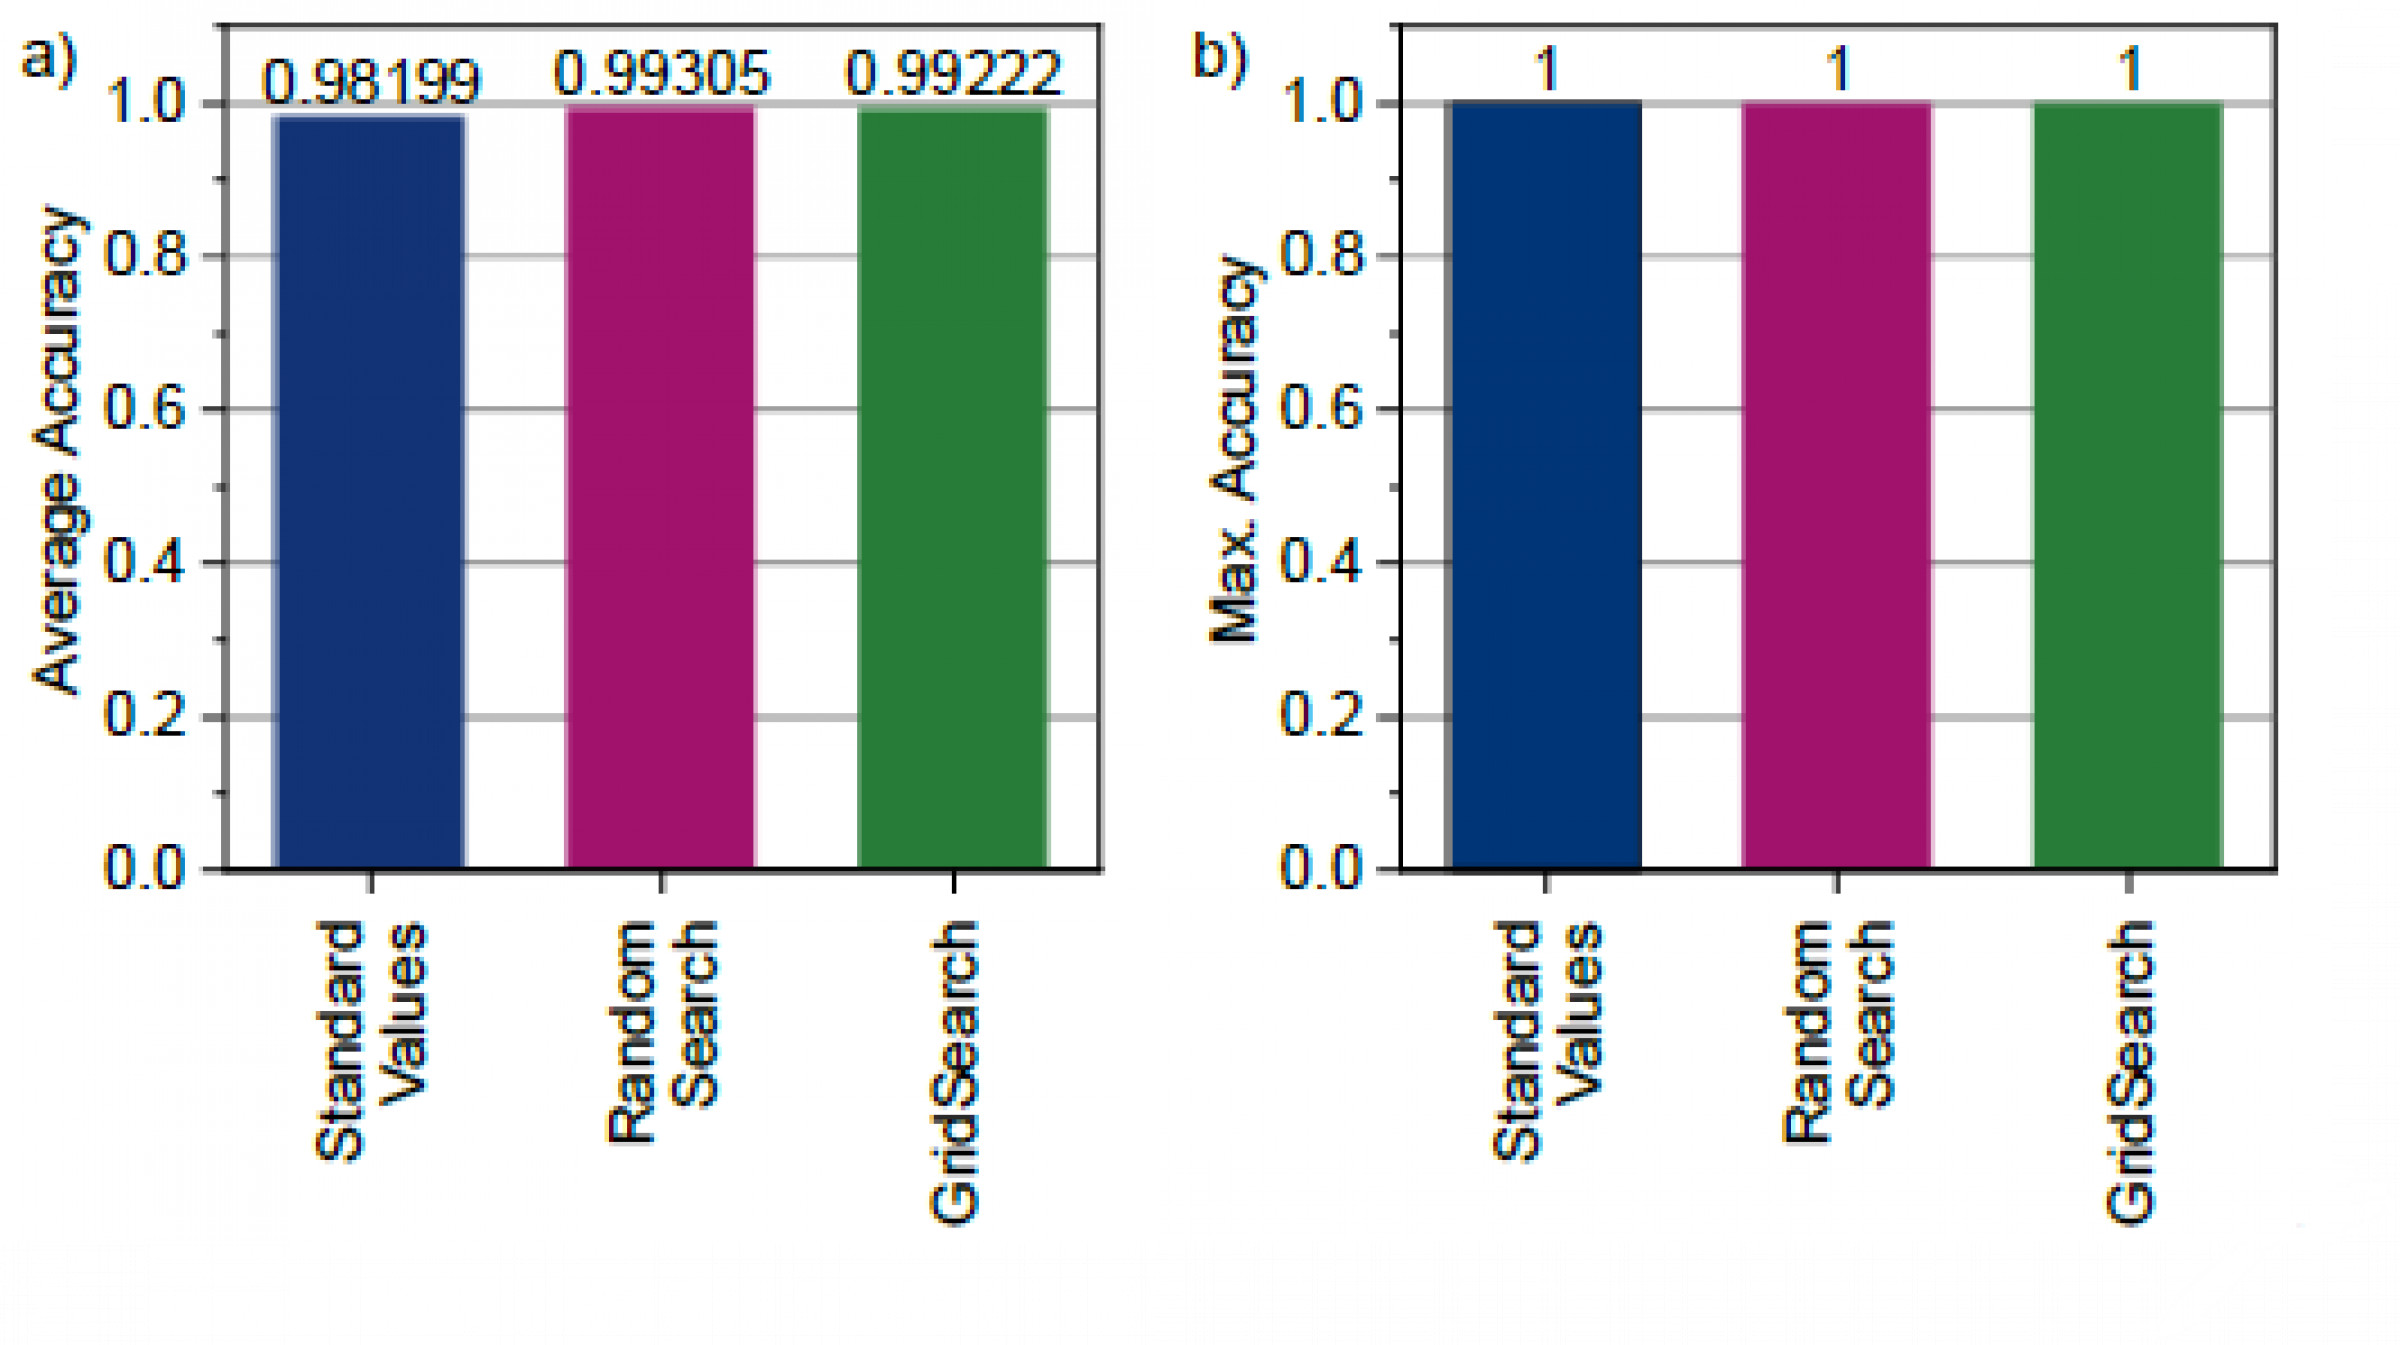
When examining the hyperparameter selection strategies for the classification models, it is noteworthy that, based on the average results, using the default settings yields the best performance. Overall, however, it was possible to achieve 100 % accuracy both with the default values and by using grid search or random search to define optimal hyperparameters (see Fig 16).
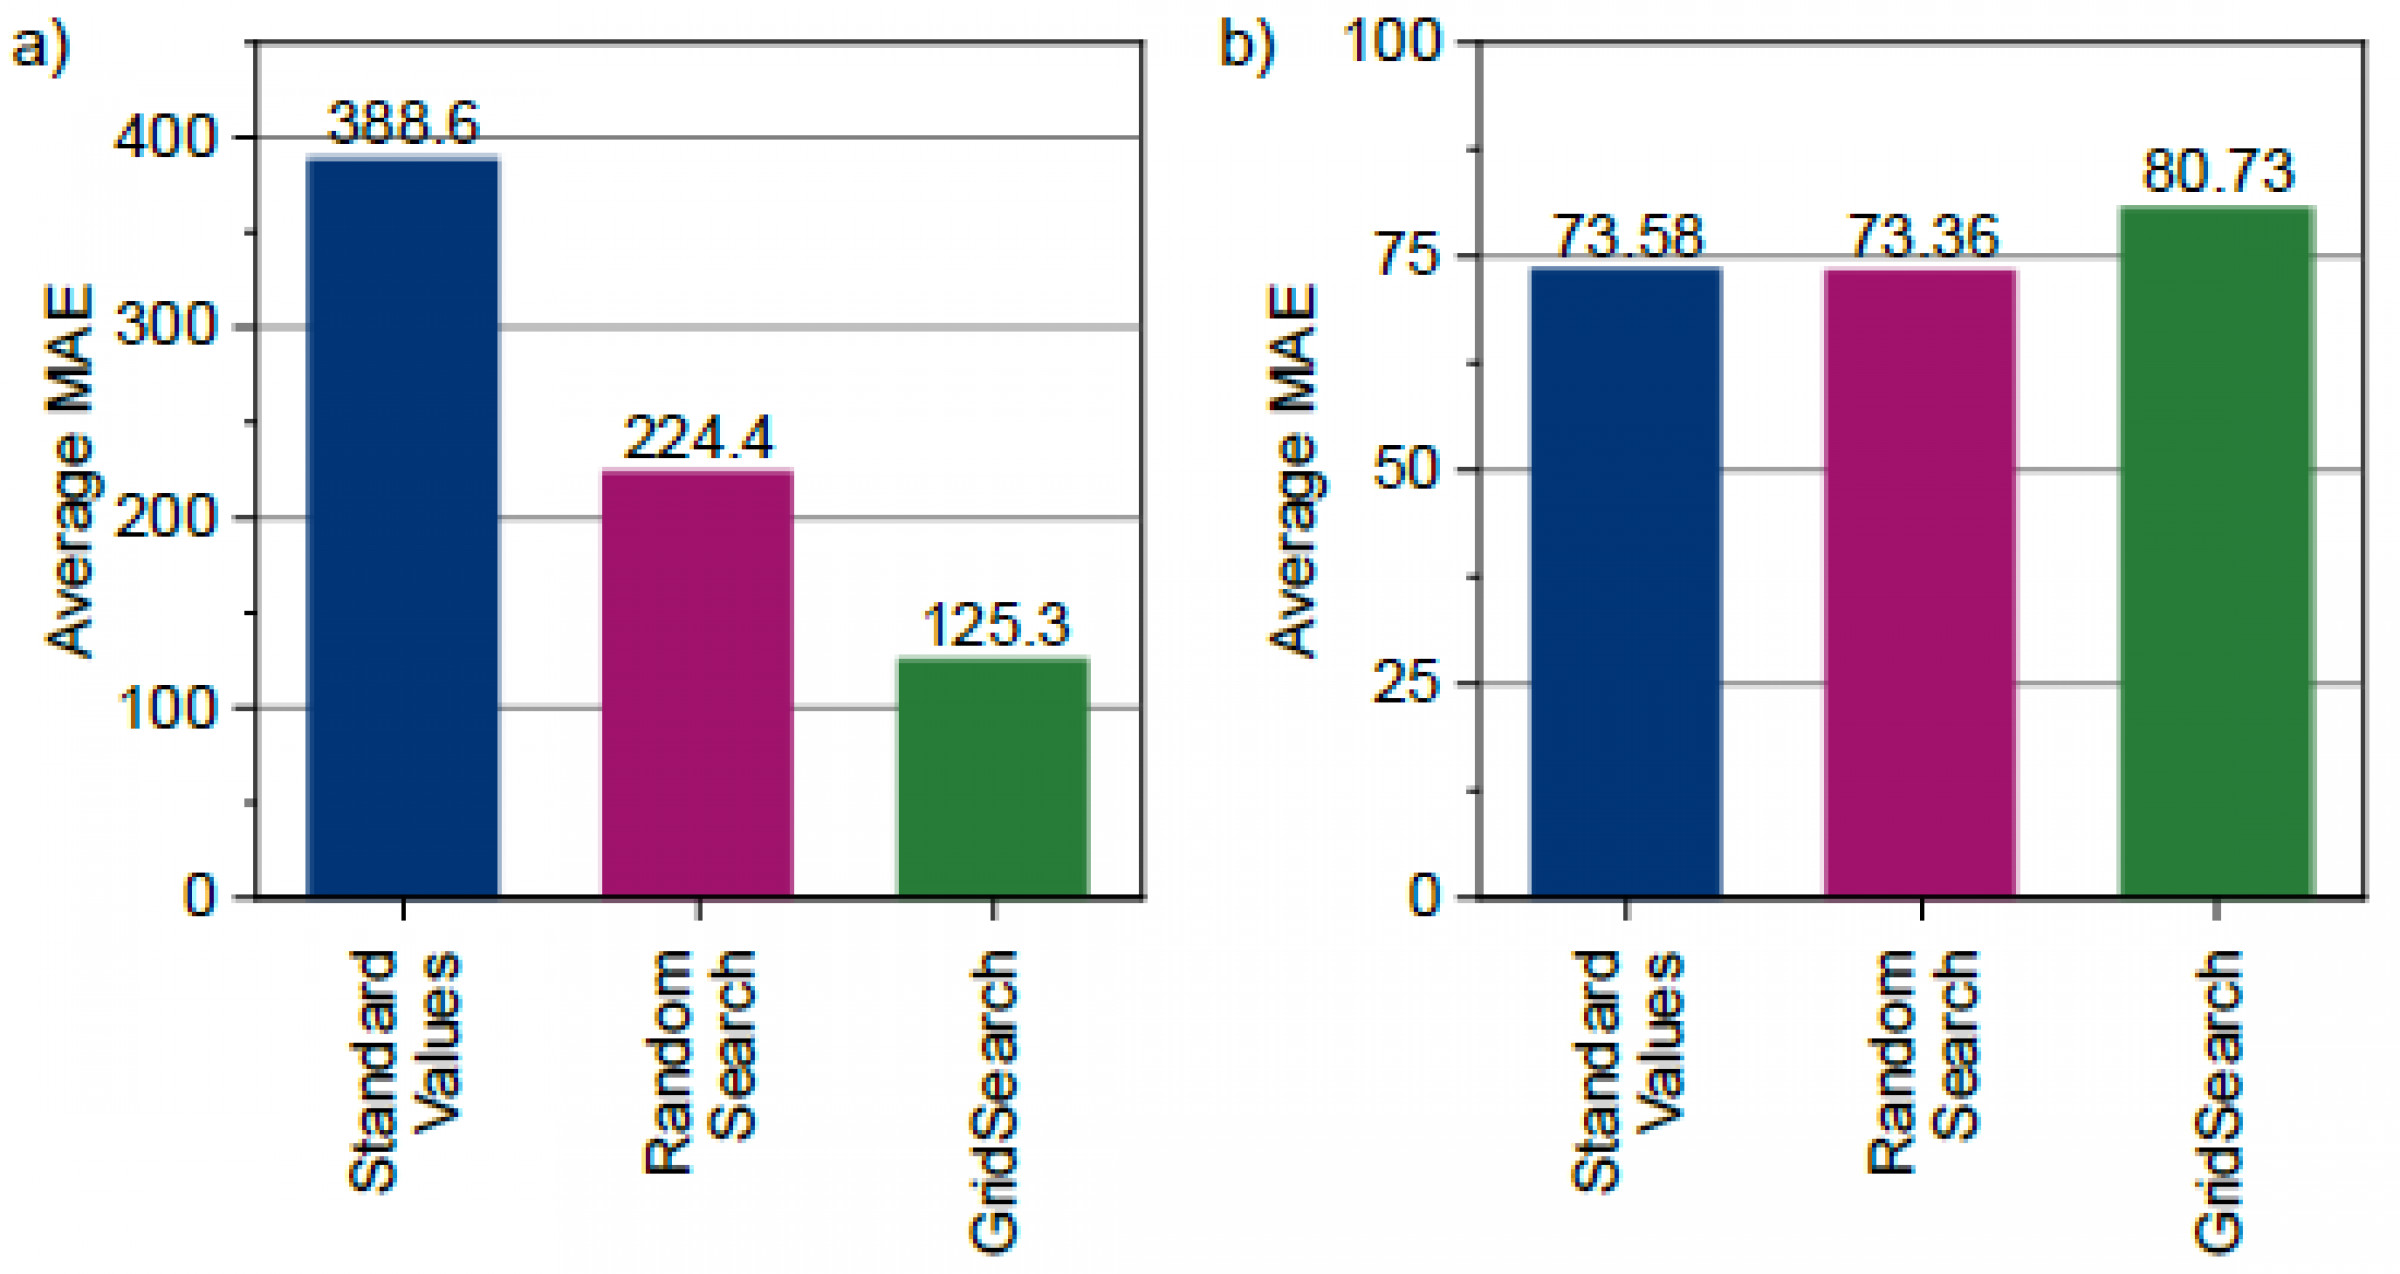
In terms of hyperparameter tuning for the machine learning methods used to predict pull-out force, on average the best parameters were found via grid search, but the lowest MAE was achieved by random search, as illustrated in Fig. 17. It should be noted, however, that due to resource constraints grid search could not be applied to every method.
Since 600 data records represent a relatively small dataset for machine learning, data augmentation was employed to expand the training data. However, data augmentation yielded no significant improvement in either classification or regression performance. On the contrary, for classification the use of data augmentation even resulted in slightly worse outcomes (see Fig. 18).
For the prediction of pull-out force, the question arose whether scaling the data would lead to better results, since this approach can assign less weight to outliers during model training. Indeed, scaling the data prior to training yielded improved outcomes (see Fig. 19).
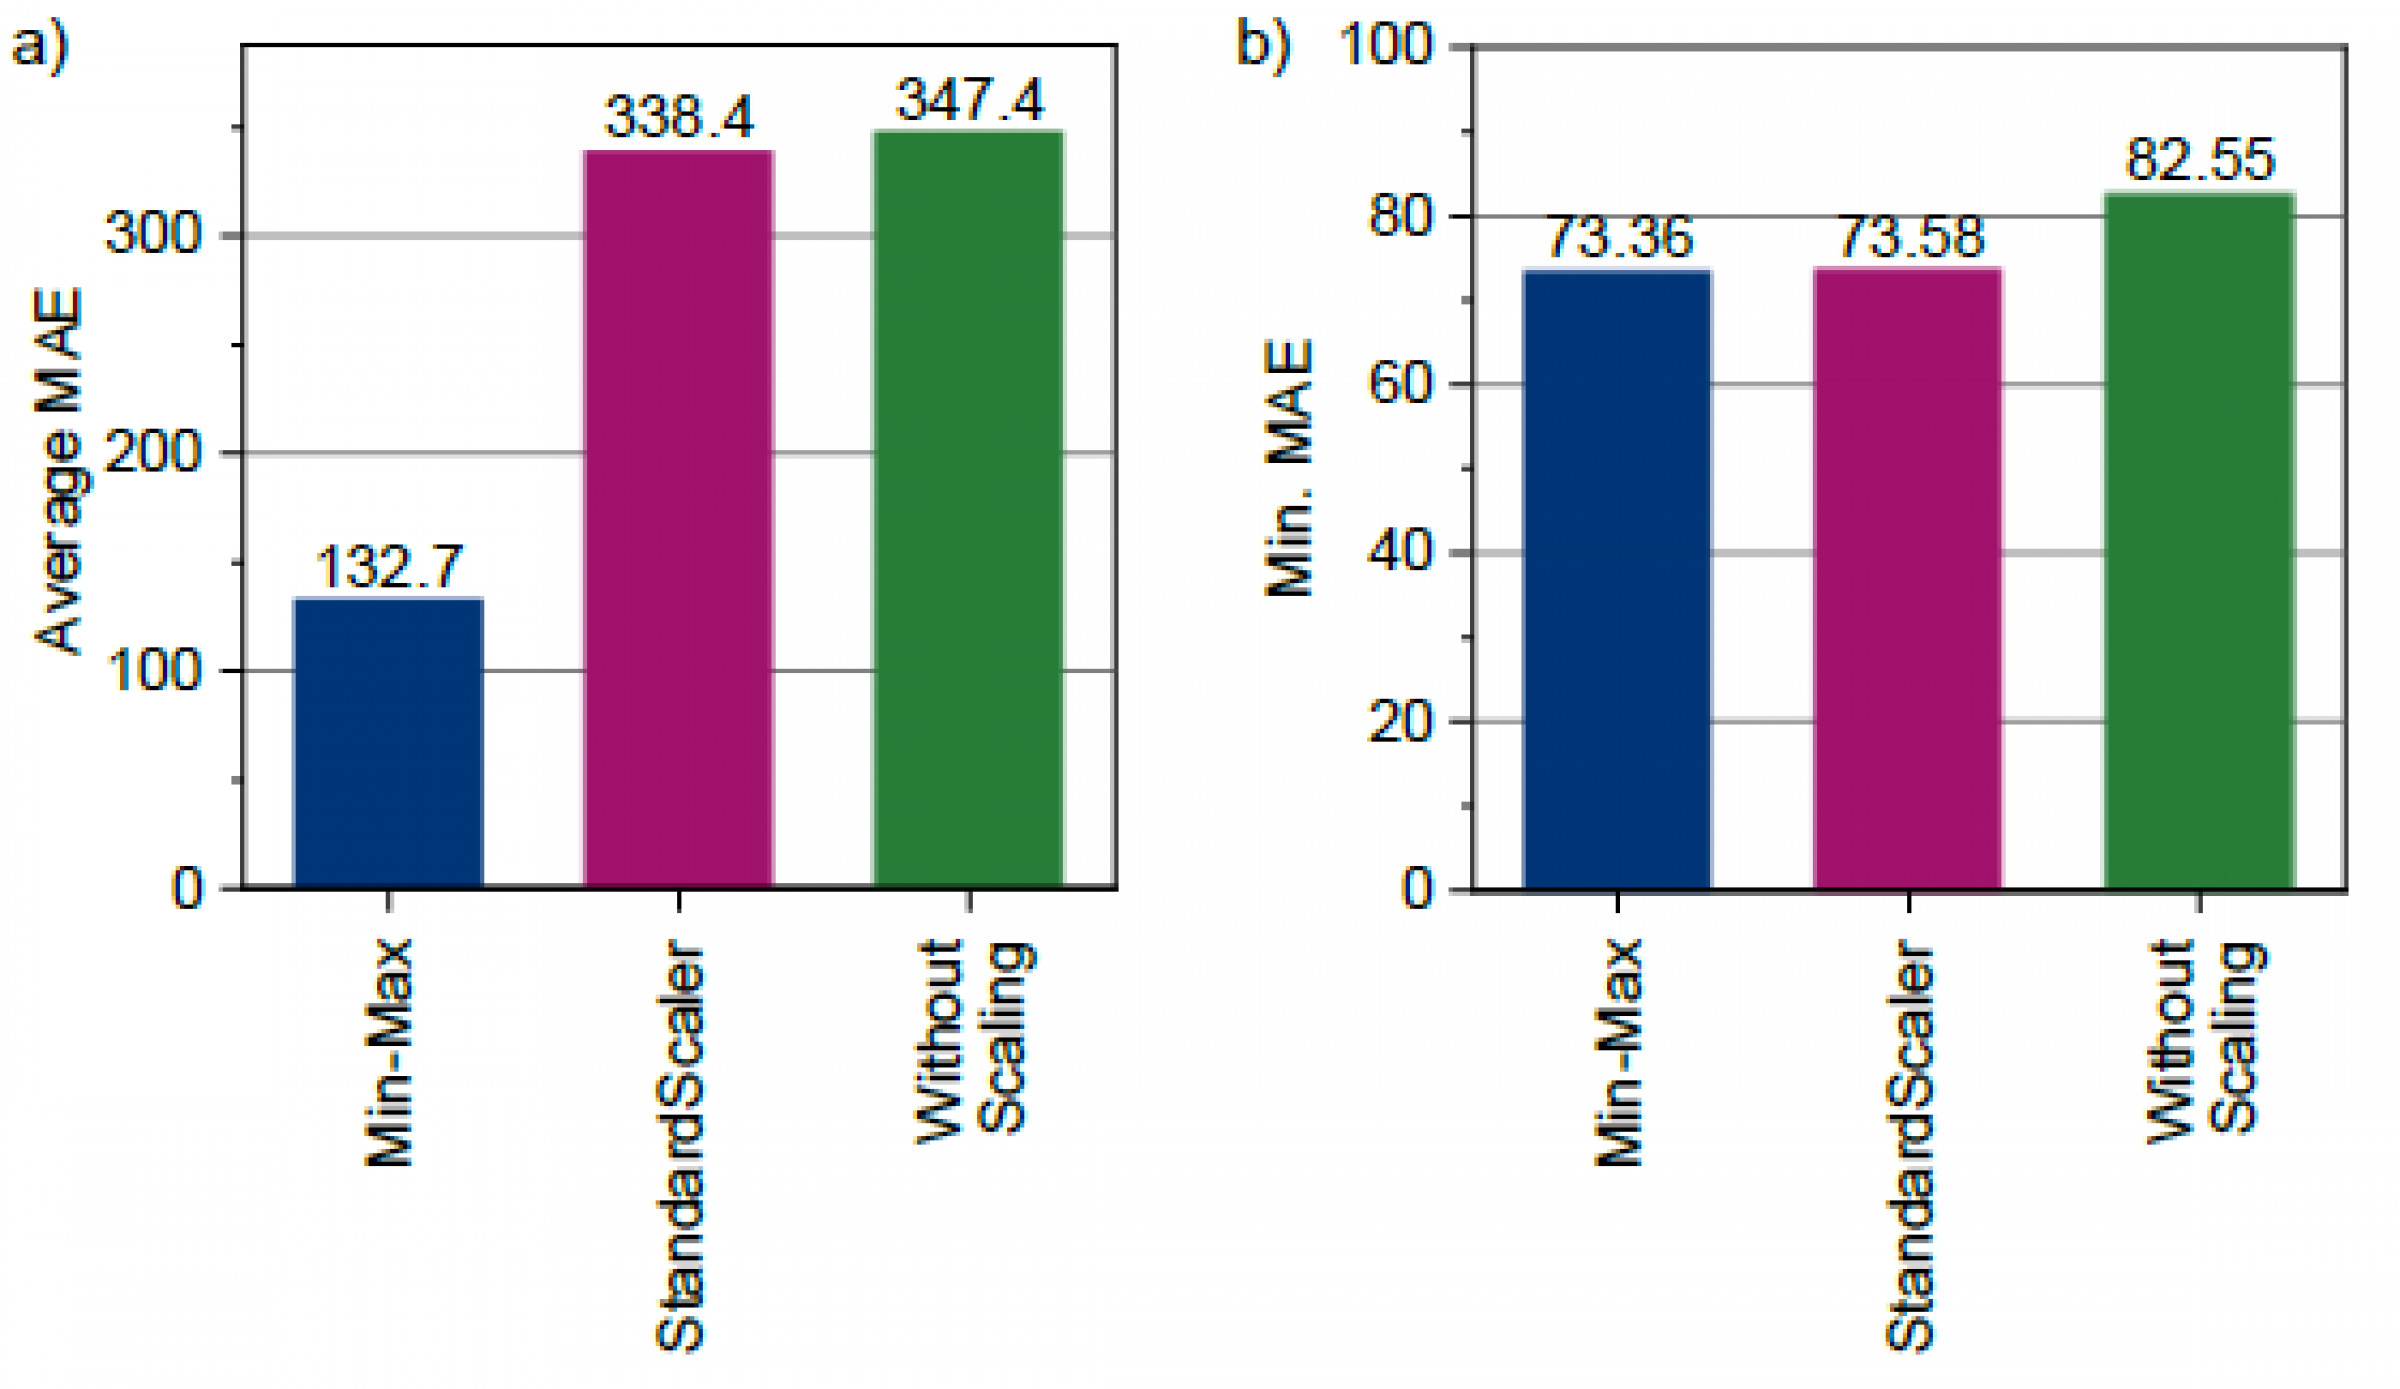
Moreover, it can be observed that the Min–Max Scaler delivers better results on average; however, the best overall result was achieved with a Standard Scaler.
Within the raw data were welding curves whose pull-out force was recorded as 0. These values should not be interpreted as measurement errors or missing data but have a clear physical basis. They indicate that the joint came apart immediately after the welding process, so no pull-out force measurement could be carried out. To determine whether these curves influence the models, experiments were excluding curves with pull-out force = 0 were carried out. When comparing the two datasets (all data vs. without pull-out force = 0), there was generally an increase in MAE in the reduced sample of about 0.2 % to 9 %. This shows that datasets with a pull-out force of 0 also make a crucial contribution to the models’ learning. Overall, 21 models for predicting the welding classes achieve 100 % accuracy. Table 7 below provides a detailed overview of these models.

Note: The numbers in the PCA column indicate the number of principal components. The best model for predicting pull-out force, with an MAE of 73.4, an MSE of 10,718.53, an RMSE of 103.53, and an R² value of 0.99, is characterized by the features listed in Table 8:

The industry usually works with smaller datasets because companies typically only perform a limited number of ultrasonic welds to calibrate the machines. For this reason, the overall dataset has been subsampled into smaller datasets. Pull-out force prediction utilized random subsamples of varying sizes (50-500 records) from the original dataset. While regression used simple random sampling, classification employed stratified sampling to select equal numbers of samples from each welding class, preserving the original class distribution. The tested model, a random forest, achieved perfect classification metrics for sample sizes of 50, 100, 300 and 400. There were slight inconsistencies in the accuracy, recall and F1 score for sample sizes of 200 and 600. It can therefore be concluded that random forest classification remains stable at a high-performance level when the sample size changes. The tested regression model clearly demonstrates that its predictive performance is dependent on the quantity of available training data. While the results are acceptable with smaller subsamples, the performance is noticeably lower compared to larger datasets. From a sample size of around 200 onwards, however, the model starts to perform much more reliably, producing better, more stable values across all regression metrics.
3.2. Target metric for joint quality evaluation
3.2.1. Ampacity testing
In industrial practice but also in scientific investigations the mechanical performance of ultrasonic welds is commonly assessed through pull-out tests. The resulting joint strength is often used not only as a direct quality indicator, but also as a proxy for functional reliability, particularly with respect to the ampacity of the joint. However, it remains unclear whether maximum pull-out force correlates with optimal electrical performance. To evaluate this assumption, a series of experiments was conducted to assess the validity of pull-out force as a predictive quality metric in ultrasonic metal welded wire/terminal joints. According to literature, ultrasonic metal welding typically leads to grain refinement in the joining zone due to dynamic recrystallization (DRX) processes triggered by high shear strains and localized heating [40–44]. From a materials science perspective, however, fine-grained microstructures are known to exhibit higher electrical resistivity compared to coarse-grained ones, due to the increased scattering of charge carriers at grain boundaries [45–48]. This implies that welds with maximized pull-out force, presumably associated with a refined microstructure, may paradoxically show reduced electrical conductivity, whereas lower-strength welds with coarser grains could in fact exhibit better ampacity.
To investigate this hypothesis, three characteristic welding conditions (underwelded, optimally welded, and overwelded) were defined based on pull-out testing and different welding times. These samples were then subjected to high-current testing at 200 A, 500 A, and 800 A. The thermal response of the different weld states is shown in Fig. 20. Temperature increase is caused by resistive losses (Joule heating), so thermal behavior under load reflects the effectiveness of current conduction across the welded interface and along the stranded wire. For each test 16 samples were utilized. For each test condition (current level and weld state), 16 samples were evaluated. In the plots in Fig. 20 only the lowest and highest temperature curves are shown, while the range of all intermediate values is represented by an colored area.

Despite substantial differences in joint strength, the temperature rise in the joining zone remained consistently low at the nominal current of 200 A, and only minor variations were observed even at higher currents. Notably, the dominant heating occurred not at the weld interface but within the aluminum conductor itself. This suggests that the joint was not the limiting factor for current conduction, and that ampacity is largely decoupled from the mechanical integrity of the weld. Interestingly, although the weld interface exhibited negligible temperature rise across all current levels, a clear trend was observed in the stranded conductor itself. The maximum temperature measured within the aluminum wire increased both with rising current and with increasing welding time. This effect is attributed to progressive microstructural disruption of the strand bundle during the welding process. As the weld energy increases, the compaction and lateral shearing of the strands within the conductor intensifies, potentially leading to partial separation or misalignment of individual strands. Such internal damage can reduce the lateral conductivity between strands and thereby compromise the effective cross-section available for current flow. The resulting increase in local resistivity leads to enhanced Joule heating within the wire, especially under high-current conditions. These findings suggest that excessive welding energy may degrade the internal electrical performance of the conductor itself, even if the joint remains mechanically intact and electrically stable. However, the underlying mechanisms remain to be investigated in detail and represent a subject of future research.
The present results indicate that ampacity fails to discriminate between sound and deficient ultrasonic wire/terminal joints, whereas pull-out forces reliably reflects metallurgical bonding. This behavior is consistent with electrical contact theory: even a limited number of metallic micro-contacts can yield low contact resistance under load, while providing little mechanical load-bearing area [49]. Furthermore, the observed behavior can be explained in accordance with established process-stage models of the USMW process [50, 51]. In these models, the early phases of the welding process involve interfacial shearing as well as a surface cleaning stage, in which oxides and lubricants are disrupted and fresh metallic contact is exposed before substantial joint-area growth occurs. Hence, good electrical conductivity, thus high ampacity, can appear already at the beginning of the welding process, while the load-bearing metallurgical bond is still limited. Comparable self-cleaning and oxide-breakup has been documented in ultrasonic wire bonding, where frictional scrubbing rapidly creates conductive contacts, prior to significant bond growth [52]. While these process models were primarily derived from sheet/sheet and micro- bond geometries, the underlying mechanism of oxide disruption as well as the formation of initial, conductive micro-contacts likely translates to wire/terminal joints. However, the extent of this behavior for USMW of these joints remains a subject of ongoing research. Collectively, the evidence supports the conclusion that ampacity is an inadequate primary quality metric, whereas pull-out force provides a robust basis for acceptance by directly reflecting metallurgical bonding of the joint.
3.2.2. Microstructural analysis
To further investigate the potential microstructural causes for the observations made during ampacity testing, EBSD analyses were conducted on cross-sections taken from the interface of aluminum wire/terminal joints. The EBSD detail maps shown in Fig. 21 illustrate the grain orientation and morphology in the aluminum strand adjacent to the terminal, recorded for welding times of 200 ms, 800 ms, 1500 ms, and 1900 ms.

Contrary to many published reports, which describe significant grain refinement due to dynamic recrystallization during ultrasonic metal welding [2, 40, 43, 53, 54], the present results consistently show grain coarsening at the weld interface. At short welding times (200 ms), the microstructure remains relatively undeformed, with small, equiaxed grains and random orientation. As the welding time increases to 800 ms and 1500 ms, a distinct zone of elongated and partially oriented grains forms directly beneath the terminal interface. These grains show a strong <101> texture and reach diameters of up to 50 µm. The boundary character distribution indicates a dominance of low-angle grain boundaries (LAGBs), suggesting that subgrain rotation and grain growth, rather than classical nucleation and recrystallization, govern the microstructural evolution. At 1900 ms, which corresponds to an overwelded condition, the thickness of this oriented zone slightly decreases, but the coarse grain morphology persists. The transition from fine to coarse grains with increasing energy input implies that localized recrystallization is not the dominant mechanism; instead, the high levels of shear and thermal exposure appear to promote abnormal grain growth within the confined volume of the stranded wire near the interface.
The deviation from the grain refinement typically reported in literature for ultrasonic welding of sheet metals may be attributed to the fundamentally different geometric and volumetric conditions present in wire/terminal welds. In sheet/sheet configurations, the deformation zone is planar and thin, allowing for more uniform strain distribution and efficient dynamic recrystallization within the bonding interface. In contrast, the compaction of stranded wires during ultrasonic welding creates a complex, three-dimensional contact zone with highly localized deformation. The individual strands are confined within a limited volume and constrained by the surrounding terminal geometry, which may inhibit the nucleation of new grains and instead promote subgrain growth and coarsening. Moreover, the energy input is significantly higher in these confined regions, as the volume of the wire, acting as the upper joining partner, is considerably higher compared to sheet/sheet joints, which may lead to longer local thermal exposure and facilitate abnormal grain growth. Additionally, to plastify and compact the strand bundle, weld times are typically higher than in sheet/sheet joints. While sheet/sheet joints in Al/Cu stacks are frequently produced within 100-600 ms (with DRX-driven refinement observed with EBSD), wire/terminal joints often require weld times of 1,000 to 2,000 ms, increasing thermal exposure from frictional heating [41, 55, 56]. In that regime, microstructure evolution is expected to be dominated by recovery and subgrain growth, rather than classical DRX, which aligns with the LAGB-rich interface, observed with EBSD [57]. These findings highlight the need to reconsider common assumptions about microstructural evolution in USMW and suggest that process models derived from sheet-metal studies may not be directly transferable to wire-based applications. Further investigations into the effects of strand architecture, contact pressure distribution, and energy dissipation are required to fully understand the governing mechanisms of grain development in such welds.
3.2.3. Local hardness evaluation
To validate the microstructural findings obtained from EBSD, nanoindentation measurements were carried out on the aluminum strands in the terminal-adjacent region of the welds. The goal was to confirm whether the observed grain coarsening and subgrain formation correlate with changes in local mechanical properties. The results clearly showed a progressive reduction in hardness with increasing welding time, thereby supporting the interpretation derived from orientation mapping. As shown in Fig. 22, the measured Vickers hardness (HV 0.01) decreased from approximately 50 HV at 100 ms to around 36 HV at 2000 ms. In addition to this temporal trend, a spatial gradient was observed: the hardness values declined with decreasing distance to the terminal interface, indicating that both plastic deformation and thermal exposure are most pronounced in this region.

These findings align with the EBSD data, which showed a growing zone of coarsened grains and low-angle grain boundaries near the terminal interface. The decreasing hardness is attributed to subgrain growth, recovery processes, and reduced dislocation density, typical effects of prolonged thermomechanical loading. At longer welding times, the softened region extended up to 50 µm into the strand, confirming the spatial extent of microstructural transformation.
4. Conclusions
The primary objective of the project was to develop a machine learning model for process monitoring of ultrasonic welding that enables both the classification into different welding classes and the prediction of pull-out force. The development process was guided by the CRISP-DM standard.
A major challenge was the “curse of dimensionality,” caused by the high number of measurement points per weld (up to 2,400) combined with a limited number of training samples (600 in total). This can lead to difficulties in pattern recognition and to overfitting. To address this problem, various data preparation and feature reduction approaches were investigated. The use of statistical features (e.g., minimum, maximum, median, standard deviation, and specific metrics like the “bend” point) in combination with cross validation to prevent overfitting proved to be far more effective than reducing data points via subsampling. A PCA-based feature extraction analysis offered also no clear advantage.
For welding class classification, virtually all the tested machine learning algorithms (except the MLPClassifier) achieved a maximum accuracy of 100 %, especially when using statistical features. In contrast, for predicting pull-out force the results varied more widely, with a support vector machine (MAE of 73.4), KNeighbors (MAE of 73.6), and an MLPRegressor (MAE of 79.2) delivering the best performance. However, the performance of all the linear models was consistently worse than that of the machine learning models.
Scaling the data before training led to improved regression results, with the Min–Max Scaler proving superior on average, although the single best result was achieved using a StandardScaler. Interestingly, datasets with a pull-out force of 0 (indicating a complete joint failure) also make a crucial contribution to the models’ learning. In contrast, data augmentation produced no significant improvements and, in some cases, even slightly worse outcomes. As shown in Figures 4 to 7, the individual defect classes in the present dataset can be clearly distinguished from one another. In other scenarios or for other welding systems, it is possible that the separation between the defect classes (or even the distinction between good and faulty welds) may not be as pronounced. In such cases, there is potential for the classification models to fall short of expectations, and an accuracy of 100% may not be achievable. However, further research is needed that includes datasets from different welding systems to address this issue.
In parallel to the development of the machine learning models for classification as well as pull-out force prediction, investigations were performed to evaluate whether joint strength or pull strength is a valid metric for judging quality of USMW joints of conductors. This was accomplished via ampacity testing and microstructural analysis of the interface region. It was initially assumed that a wire/terminal joint with high mechanical performance would show lower ampacity than an over- or under-welded joint, as DRX and grain refinement is commonly observed during USMW of sheet/sheet joints, which in turn leads to electron scattering at the significantly increased amount of grain boundaries, ultimately resulting in higher electrical resistance. However, ampacity testing showed that joints with maximized mechanical strength as well as underwelded or overwelded joints with poor mechanical strength exhibited excellent thermal stability under currents of up to 800 A, demonstrating an independence of the electrical from the mechanical properties. In all tested samples, the joining zone itself showed minimal temperature rise, while the heating was primarily located in the aluminum conductor. To investigate, if the microstructure of the joints exhibits the initially assumed grain refinement, EBSD was performed. Contrary to the assumption, EBSD revealed recovery and grain coarsening at the interface rather than refinement. Instead, a zone of coarse, <101>-oriented grains formed in terminal proximity, increasing in thickness with higher welding energies. This grain growth behavior suggests that the microstructural evolution in wire-based ultrasonic welds is fundamentally different from that in sheet configurations, likely due to geometric confinement, localized energy density, and increased thermal exposure due to higher weld times compared to sheet/sheet USMW welds. To validate these microstructural observations, nanoindentation tests were performed in the terminal-adjacent region of the conductor. The results showed a clear decrease in local hardness with increasing welding time and decreasing distance to the interface, consistent with subgrain growth and reduced dislocation density. The mechanical softening confirmed by nanoindentation supports the EBSD-based interpretation and illustrates the localized degradation effects induced by excessive weld energy.
While the definitive reasons for the difference in the grain structures at the interface of Al-sheet/Cu-sheet and Al-wire/Cu-terminal joints remain an object for further research, the findings support the continued use of pull-out force as a robust and meaningful target metric in ultrasonic metal welding of wire/terminal joints. While ampacity remains important for electrical design validation, it does not reflect the mechanical integrity of the joint and should not be used as a standalone acceptance metric.
Funding Information
This work is part of the research project “Entwicklung eines Prozessüberwachungssystems mit Entscheidungsunterstützung beim Metall-Ultraschallschweißen elektrisch leitfähiger Verbindungen” which is funded by the Federal Ministry of Economic Affairs and as part of the "Industrial Collective Research" programme on the basis of a resolution of the German Bundestag. This project 01IF22561N / 05.3545 from the Research Association of the German Welding Society (DVS), Düsseldorf, is carried out at Chemnitz University of Technology
References
- Balle F, Magin J. Ultrasonic Spot and Torsion Welding of Aluminum to Titanium Alloys: Process, Properties and Interfacial Microstructure. Physics Procedia. 2015;70:846–9. doi:10.1016/j.phpro.2015.08.173.
- Bergmann JP, Regensburg A, Schürer R, Petzoldt F, Herb A. Effect of the interface characteristics on the joint properties and diffusion mechanisms during ultrasonic metal welding of Al/Cu. Weld World. 2017;61:499–506. doi:10.1007/s40194-017-0449-6.
- Wagner G, Balle F, Eifler D. Ultrasonic Welding of Aluminum Alloys to Fiber Reinforced Polymers. Adv Eng Mater. 2013;15:792–803. doi:10.1002/adem.201300043.
- Helfers E, Müller FW, Schiebahn A, Reisgen U. Influence of surface condition of copper sheets on ultrasonic metal welding. Journal of Advanced Joining Processes. 2024;9:100204. doi:10.1016/j.jajp.2024.100204.
- Sahoo SK, Satpathy MP. Ultrasonic Welding of Metal Sheets. First edition. | Boca Raton : CRC Press, 2021.: CRC Press; 2020.
- Leon M de, Shin H-S. Review of the advancements in aluminum and copper ultrasonic welding in electric vehicles and superconductor applications. Journal of Materials Processing Technology. 2022;307:117691. doi:10.1016/j.jmatprotec.2022.117691.
- Matheny MP, Graff KF. Ultrasonic welding of metals. In: Power Ultrasonics: Elsevier; 2015. p. 259–293. doi:10.1016/B978-1-78242-028-6.00011-9.
- Wright NW, Robson JD, Prangnell PB. Effects of Thickness Combinations on Joint Properties and Process Windows in Ultrasonic Metal Welding. In: SAE World Congress & Exhibition; APR. 20, 2009: SAE International400 Commonwealth Drive, Warrendale, PA, United States; 2009. doi:10.4271/2009-01-0027.
- Das A, Masters I, Williams D. Process robustness and strength analysis of multi-layered dissimilar joints using ultrasonic metal welding. Int J Adv Manuf Technol. 2019;101:881–900. doi:10.1007/s00170-018-2936-3.
- Gester A, Sprigode T, Wagner G. Novel approach for in-line process monitoring during ultrasonic metal welding of dissimilar wire/terminal joints based on the thermoelectric effect. Weld World. 2025;69:363–72. doi:10.1007/s40194-024-01853-y.
- Lindamood LR, Mohr L, Moghaddas A, Kitt A, Frech T. Investigation of monitoring methods for ultrasonic metal welding. In: Zonta D, Huang H, Su Z, editors. Sensors and Smart Structures Technologies for Civil, Mechanical, and Aerospace Systems; 22.03.2021 - 27.03.2021; Online Only, United States: SPIE; 22.03.2021 - 27.03.2021. p. 15. doi:10.1117/12.2583121.
- Shawn Lee S, Shao C, Hyung Kim T, Jack Hu S, Kannatey-Asibu E, Cai WW, et al. Characterization of Ultrasonic Metal Welding by Correlating Online Sensor Signals With Weld Attributes. Journal of Manufacturing Science and Engineering 2014. doi:10.1115/1.4028059.
- Schwarz EB, Bleier F, Guenter F, Mikut R, Bergmann JP. Improving process monitoring of ultrasonic metal welding using classical machine learning methods and process-informed time series evaluation. Journal of Manufacturing Processes. 2022;77:54–62. doi:10.1016/j.jmapro.2022.02.057.
- Li J, Balle F. In-situ observation of the bond formation process during ultrasonic metal welding of Al/Cu joints using Laser Doppler Vibrometry. Journal of Manufacturing Processes. 2023;106:1–11. doi:10.1016/j.jmapro.2023.09.077.
- Gester A, Wagner G, Pöthig P, Bergmann JP, Fritzsche M. Analysis of the oscillation behavior during ultrasonic welding of EN AW-1070 wire strands and EN CW004A terminals. Weld World. 2022;66:567–76. doi:10.1007/s40194-021-01222-z.
- Balz I, Raad EA, Rosenthal E, Lohoff R, Schiebahn A, Reisgen U, Vorländer M. Process monitoring of ultrasonic metal welding of battery tabs using external sensor data. Journal of Advanced Joining Processes. 2020;1:100005. doi:10.1016/j.jajp.2020.100005.
- Lindamood LR, Matheny MP, Graff KF. Ultrasonic welding of metals. In: Power Ultrasonics: Elsevier; 2023. p. 163–204. doi:10.1016/B978-0-12-820254-8.00012-9.
- Zhang C, Li H, Liu Q, Huang C, Zhou K. Ultrasonic Welding of Aluminum to Steel: A Review. Metals. 2023;13:29. doi:10.3390/met13010029.
- Elangovan S. Experimental and theoretical investigations on temperature distribution at the joint interface for copper joints using ultrasonic welding. Manufacturing Rev. 2014;1:18. doi:10.1051/mfreview/2014017.
- Abi Raad E, Vorländer M. Acoustic monitoring of weld strength in ultrasonic metal welding by tracking welding stages. Journal of Manufacturing Processes. 2023;101:1055–64. doi:10.1016/j.jmapro.2023.06.052.
- Dodiya V, Bhavsar S, Kansara N, Murarka N, Desai KP, Dave HK, Patel HV. Acoustic Emission System for Monitoring Mechanical Behavior During Ultrasonic Metal Welding. In: Kumar S, Rajurkar KP, editors. Advances in Manufacturing Systems. Singapore: Springer Singapore; 2021. p. 319–327. doi:10.1007/978-981-33-4466-2_27.
- Nazir Q, Shao C. Online tool condition monitoring for ultrasonic metal welding via sensor fusion and machine learning. Journal of Manufacturing Processes. 2021;62:806–16. doi:10.1016/j.jmapro.2020.12.050.
- Kim B-J, Hwang I, Son S-G, Park C, Kim Y-M. Review on Ultrasonic Welding Quality Monitoring Technology. J Weld Join. 2024;42:215–22. doi:10.5781/JWJ.2024.42.2.9.
- Lu K-C, Meng Y, Dong Z, Shao C. Online Cost-Effective Classification of Mixed Tool and Material Conditions in Ultrasonic Metal Welding: Towards Integrated Monitoring and Control. In: ASME 2023 18th International Manufacturing Science and Engineering Conference; 12.06.2023 - 16.06.2023; New Brunswick, New Jersey, USA: American Society of Mechanical Engineers; 2023. doi:10.1115/MSEC2023-104868.
- Aminzadeh A, Sattarpanah Karganroudi S, Goldak J. Insight into the Key Process Parameters on Residual Stress Distribution in Deep Drawing of Laser-Welded Blanks: Response Surface Modeling. J. of Materi Eng and Perform. 2024;33:4136–48. doi:10.1007/s11665-024-09286-w.
- Aminzadeh A, Silva Rivera J, Farhadipour P, Ghazi Jerniti A, Barka N, El Ouafi A, et al. Toward an intelligent aluminum laser welded blanks (ALWBs) factory based on industry 4.0; a critical review and novel smart model. Optics & Laser Technology. 2023;167:109661. doi:10.1016/j.optlastec.2023.109661.
- Aminzadeh A, Rahmatabadi D, Pahlavani M, Moradi M, Lawrence J. Smart Laser Welding: A Strategic Roadmap Toward Sustainable Manufacturing in Industry 4.0. In: Gholami H, Abdul-Nour G, Sharif S, Streimikiene D, editors. Sustainable Manufacturing in Industry 4.0. Singapore: Springer Nature Singapore; 2023. p. 41–56. doi:10.1007/978-981-19-7218-8_3.
- Mishra D, Roy RB, Dutta S, Pal SK, Chakravarty D. A review on sensor based monitoring and control of friction stir welding process and a roadmap to Industry 4.0. Journal of Manufacturing Processes. 2018;36:373–97. doi:10.1016/j.jmapro.2018.10.016.
- Huber C. Making The Cut. Fastening and Assembly Solutions and Technology. 2024;28:28–9. doi:10.12968/S2056-9033(24)70136-3.
- Ozherelkov D, Holländer A, Wagner G. Influence of Contamination and Passivation on the Ultrasonic Welding Performance of Aluminum Stranded Wires. In: Edwards L, editor. Light Metals 2025. Cham: Springer Nature Switzerland; 2025. p. 354–363. doi:10.1007/978-3-031-80676-6_48.
- Müller FW, Mirz C, Schiebahn A, Reisgen U. Influence of quality features, disturbances, sensor data, and measurement time on quality prediction for ultrasonic metal welding. Weld World. 2025;69:1961–89. doi:10.1007/s40194-025-01959-x.
- Telsonic AG. Ultrasonic Metal Welding – Quality Guidelines. 2022. https://www.telsonic.com/fileadmin/media/Ultrasonic_Metal_Welding_-_Quality_Guidelines.pdf. Accessed 21 Oct 2025.
- SAE/USCAR. Performance Specification for Ultrasonically Welded Wire Terminations 11.07.2023. 400 Commonwealth Drive, Warrendale, PA, United States: SAE International. doi:10.4271/USCAR38-2.
- Pöthig P, Grätzel M, Bergmann JP. Influence of different surface conditions on mechanical properties during ultrasonic welding of aluminum wire strands and copper terminals. Weld World. 2023;67:1427–36. doi:10.1007/s40194-023-01490-x.
- Ozherelkov D, Kim J, Gester A, Fritzsche M, Rebrin M, Sprigode T, et al. Effect of storage parameters and surface state on the ultrasonic welding behavior and mechanical properties of aluminum stranded wires. Weld World 2025. doi:10.1007/s40194-025-02196-y.
- IEC. Solderless connections - Part 9: Ultrasonically welded connections 12.2024. Berlin: DIN Media GmbH. doi:10.31030/3570701.
- Shao C, Hyung Kim T, Jack Hu S, Jin J, Abell JA, Patrick Spicer J. Tool Wear Monitoring for Ultrasonic Metal Welding of Lithium-Ion Batteries. Journal of Manufacturing Science and Engineering 2016. doi:10.1115/1.4031677.
- Thul F, Liesegang M. Estimation of wear behaviour for structures of ultrasonic welding sonotrodes by finite element simulations. Wear. 2025;570:205973. doi:10.1016/j.wear.2025.205973.
- Schröer C, Kruse F, Gómez JM. A Systematic Literature Review on Applying CRISP-DM Process Model. Procedia Computer Science. 2021;181:526–34. doi:10.1016/j.procs.2021.01.199.
- Su Z, Zhu Z, Zhang Y, Zhang H, Xiao Q. Recrystallization Behavior of a Pure Cu Connection Interface with Ultrasonic Welding. Metals. 2021;11:61. doi:10.3390/met11010061.
- Xie J, Zhu Y, Bian F, Liu C. Dynamic recovery and recrystallization mechanisms during ultrasonic spot welding of Al-Cu-Mg alloy. Materials Characterization. 2017;132:145–55. doi:10.1016/j.matchar.2017.06.018.
- Balz I, Rosenthal E, Reimer A, Turiaux M, Schiebahn A, Reisgen U. Analysis of the thermo-mechanical mechanism during ultrasonic welding of battery tabs using high-speed image capturing. Weld World. 2019;63:1573–82. doi:10.1007/s40194-019-00788-z.
- Ji H, Wang J, Li M. Evolution of the bulk microstructure in 1100 aluminum builds fabricated by ultrasonic metal welding. Journal of Materials Processing Technology. 2014;214:175–82. doi:10.1016/j.jmatprotec.2013.09.005.
- Haddadi F, Tsivoulas D. Grain structure, texture and mechanical property evolution of automotive aluminium sheet during high power ultrasonic welding. Materials Characterization. 2016;118:340–51. doi:10.1016/j.matchar.2016.06.004.
- Plombon JJ, Andideh E, Dubin VM, Maiz J. Influence of phonon, geometry, impurity, and grain size on Copper line resistivity. Applied Physics Letters 2006. doi:10.1063/1.2355435.
- Abbas SF, Seo S-J, Park K-T, Kim B-S, Kim T-S. Effect of grain size on the electrical conductivity of copper–iron alloys. Journal of Alloys and Compounds. 2017;720:8–16. doi:10.1016/j.jallcom.2017.05.244.
- Santos TG, Miranda RM, Vilaça P, Teixeira JP. Modification of electrical conductivity by friction stir processing of aluminum alloys. Int J Adv Manuf Technol. 2011;57:511–9. doi:10.1007/s00170-011-3308-4.
- Cai SL, Wan JC, Hao YJ, Koch CC. Dual gradient microstructure to simultaneously improve strength and electrical conductivity of aluminum wire. Materials Science and Engineering: A. 2020;783:139308. doi:10.1016/j.msea.2020.139308.
- Zhang C, Ren W, Liao X. On the Relationship between Contact Resistance and Load Force for Electrode Materials with Rough Surfaces. Materials (Basel) 2022. doi:10.3390/ma15165667.
- Vries E de. Mechanics and mechanisms of ultrasonic metal welding. Ohio, USA: Ohio State University; 2004.
- Balz I. Analysis of thermo-mechanical processes during the bond formation in ultrasonic metal welding: RWTH Aachen University; 2020.
- Long Y, Arndt M, Dencker F, Wurz M, Twiefel J, Wallaschek J. Impact of surface texture on ultrasonic wire bonding process. Journal of Materials Research and Technology. 2022;20:1828–38. doi:10.1016/j.jmrt.2022.07.187.
- Mondal M, Nellikode S, Park S-B, Mitsuyuki J, Lee S, Kim D-H, Park Y-D. Trade-off between dynamic recrystallization and material ejection during ultrasonic welding of cylindrical cell current collector plate and positive terminal. Int J Adv Manuf Technol. 2025;137:5837–62. doi:10.1007/s00170-025-15483-1.
- Abbas Z, Zhao L, Deng J, Wang S, Hong W. Advances in ultrasonic welding of lightweight alloys: A review. High Temperature Materials and Processes 2023. doi:10.1515/htmp-2022-0298.
- Liu G, Hu X, Fu Y, Li Y. Microstructure and Mechanical Properties of Ultrasonic Welded Joint of 1060 Aluminum Alloy and T2 Pure Copper. Metals. 2017;7:361. doi:10.3390/met7090361.
- Li J, Zillner J, Balle F. In-Depth Evaluation of Ultrasonically Welded Al/Cu Joint: Plastic Deformation, Microstructural Evolution, and Correlation with Mechanical Properties. Materials (Basel) 2023. doi:10.3390/ma16083033.
- Lv J, Zheng J-H, Yardley VA, Shi Z, Lin J. A Review of Microstructural Evolution and Modelling of Aluminium Alloys under Hot Forming Conditions. Metals. 2020;10:1516. doi:10.3390/met10111516.
Authors: Andreas Gester, Anja Tetzner, Guntram Wagner, Peter Gluchowski, Melanie Becker, Morten Deutsch, David Leoka; TU Chemnitz
Schlagworte
AluminiumAutomotive WiresClassificationCopperDevelopmentDissimilar JointsElectrical conductorsLaser TechnologyMicrostructuresProcess MonitoringRegressionResearchResearch PaperUltrasonic Metal WeldingWeld integrity